# Version 1.1.0
# What's new?
# Automation Services
On logging in to Tulip and clicking on Home, these are the changes from the past version to the current version.
| Existing | What's new |
|---|---|
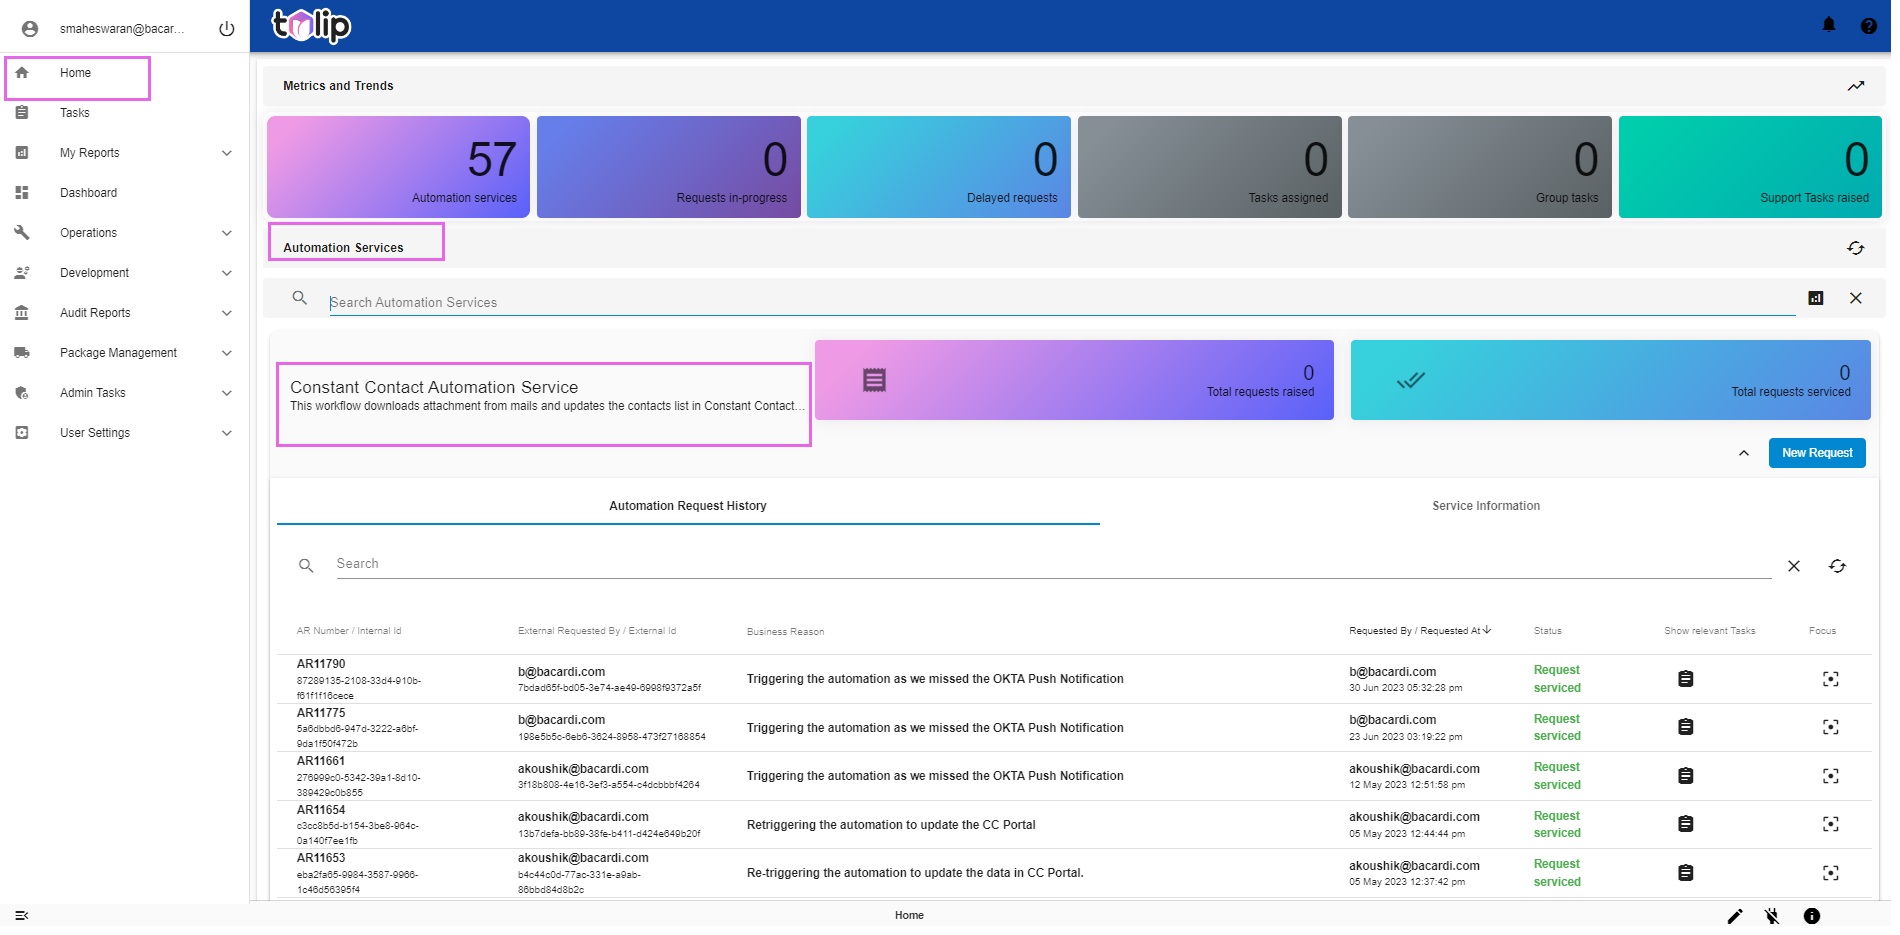 | 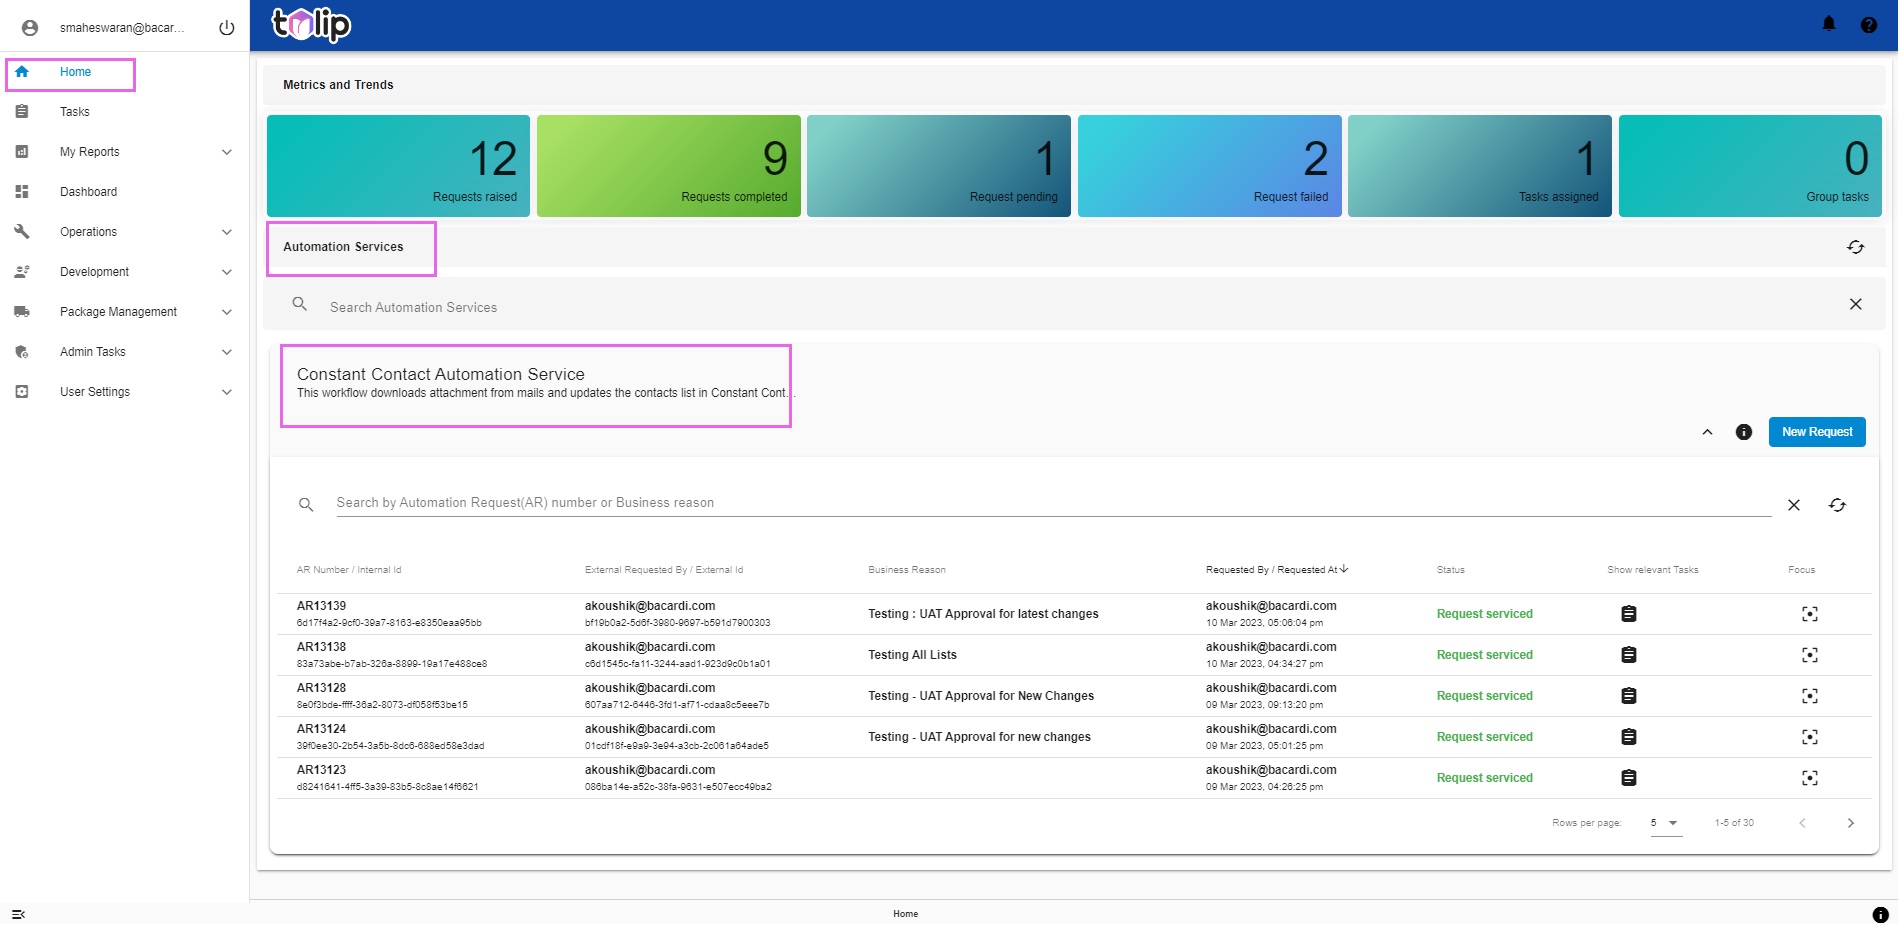 |
Clicking on any Automation Service, to know the history and diving deep in to any specific Automation Request, you can easily discern the changes. This would help you to envision the increased level of transparency this version aims to bring.
| Existing | What's new |
|---|---|
 |  |
To get a better idea on this feature, please read more here.
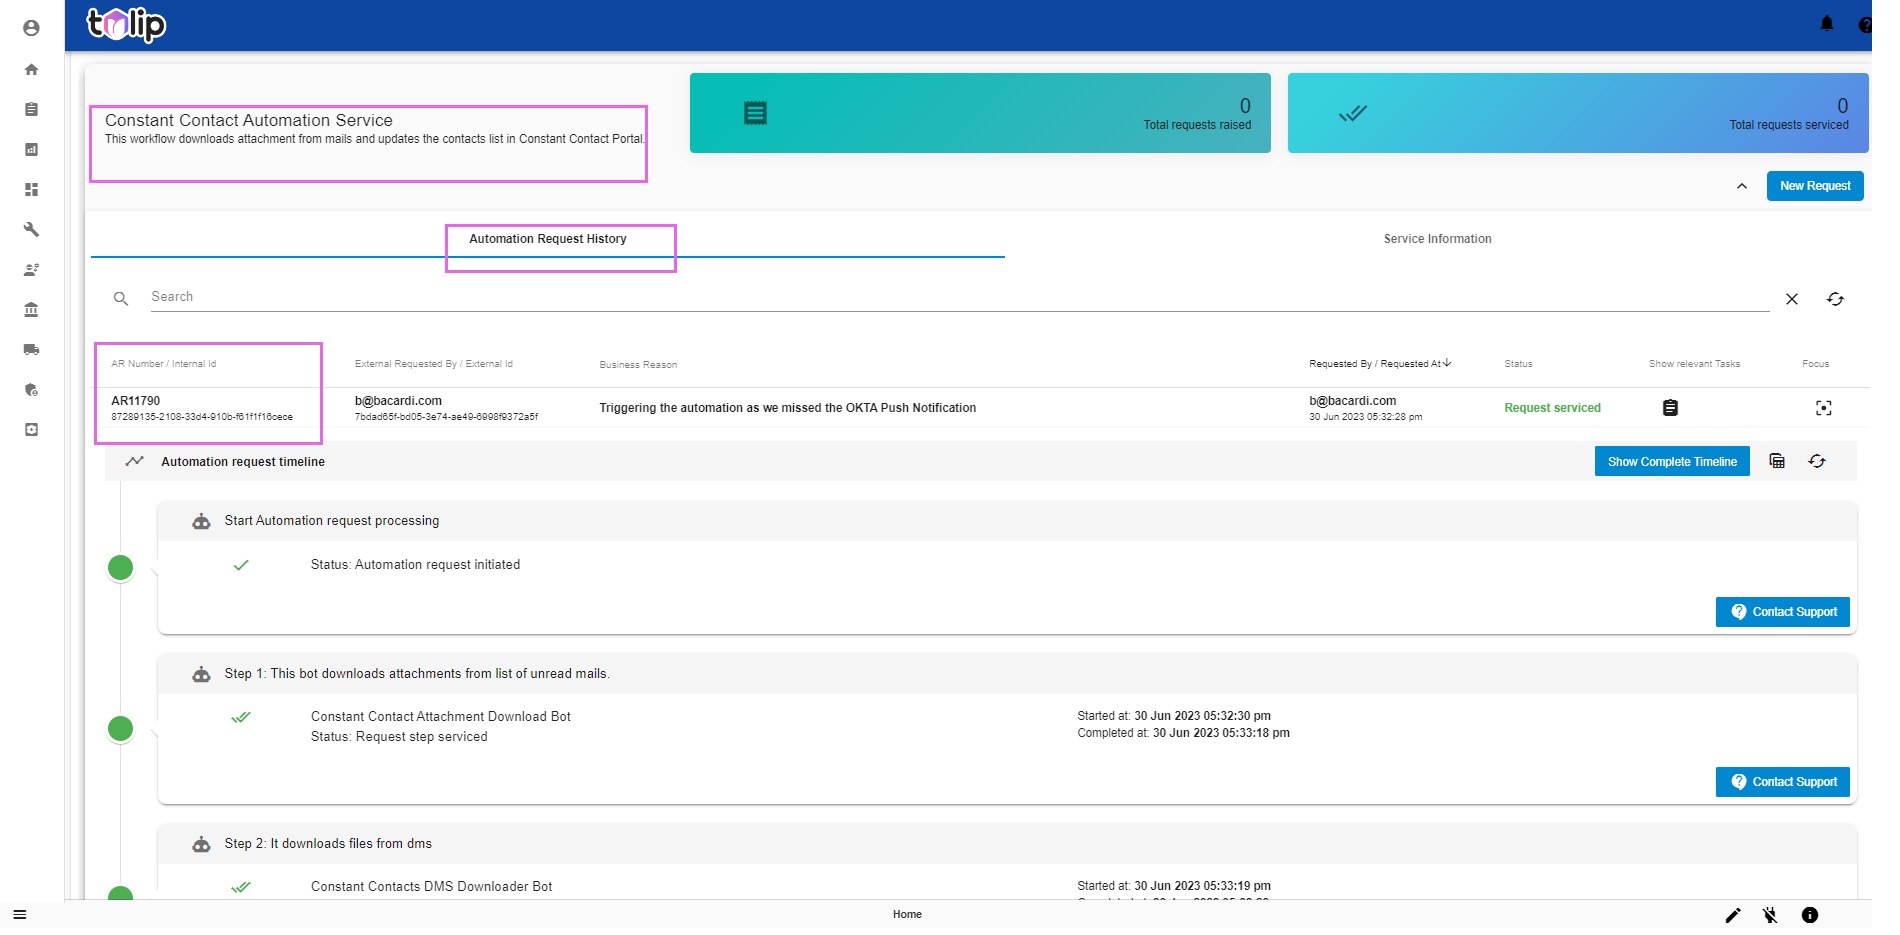
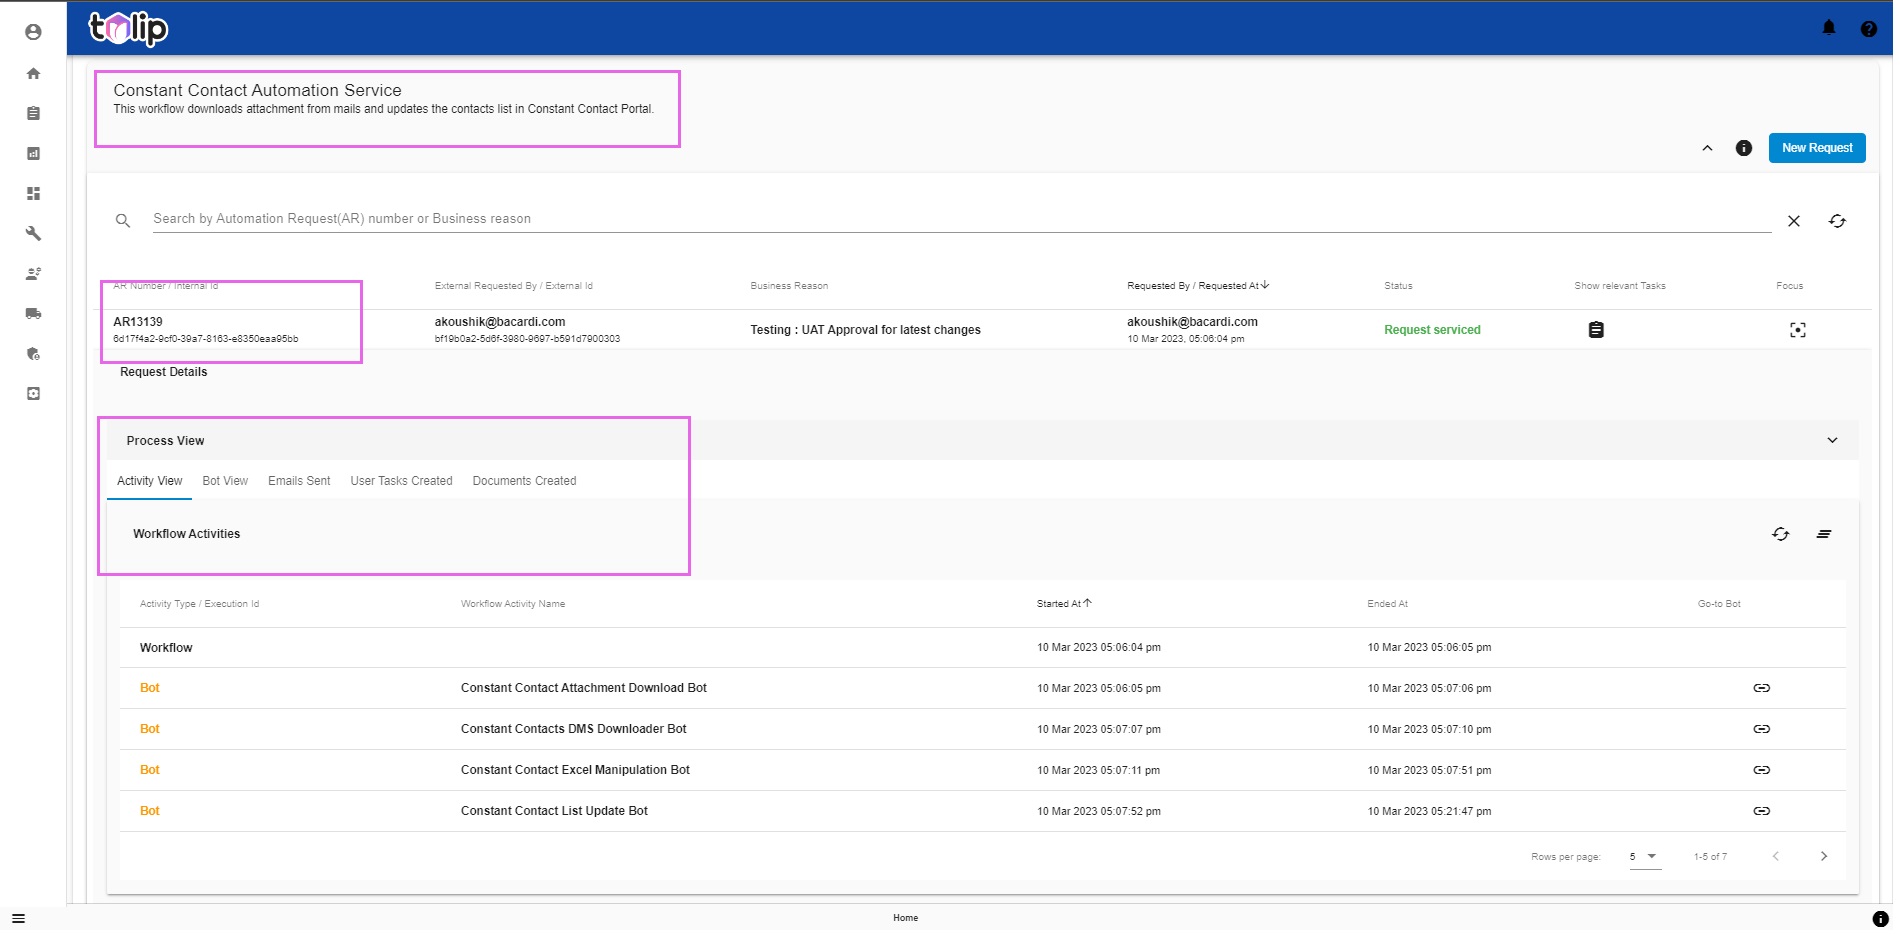
With this version of Tulip, the users (Honey Users) who trigger the Automation Service Requests are empowered by being able to track the execution path their triggered automation takes. In just easy clicks, they can view the Execution as a whole, right from the process flow to the passed in inputs, the tasks created in the course of the execution for that workflow, the emails triggered by that workflow and the output created in the form of Documents.
Disclaimer: In the case of the workflow being a parent-child combination, please note that the User Tasks and Emails Created can be viewed for the execution trigerred, i.e: For the Parent workflow only and not the child workflows. But the Documents Created section aims at showing the Documents created both for the parent as well as the child workflows associated as part of it. Also, for the Documents Created to reflect the documents, the automation has to pass the same as variables. Stay tuned to this section to view the Documents created for each automation service one by one on an incremental basis in the upcoming releases.
In case of any failures, the users can envision where the failure point is and can easily pinpoint to the bot level. This way, they can do a quick check and correct their execution if the automation has failed due to some issues with the input. As a result, the users hold control to their executions to a certain degree and can debug simple issues without waiting for Support.
Check this example execution for a better idea.
Note: Please note that all this is applicable for the automation service requests to be triggered going forward. It is not possible to view the above mentioned features for the past gone by automation requests.
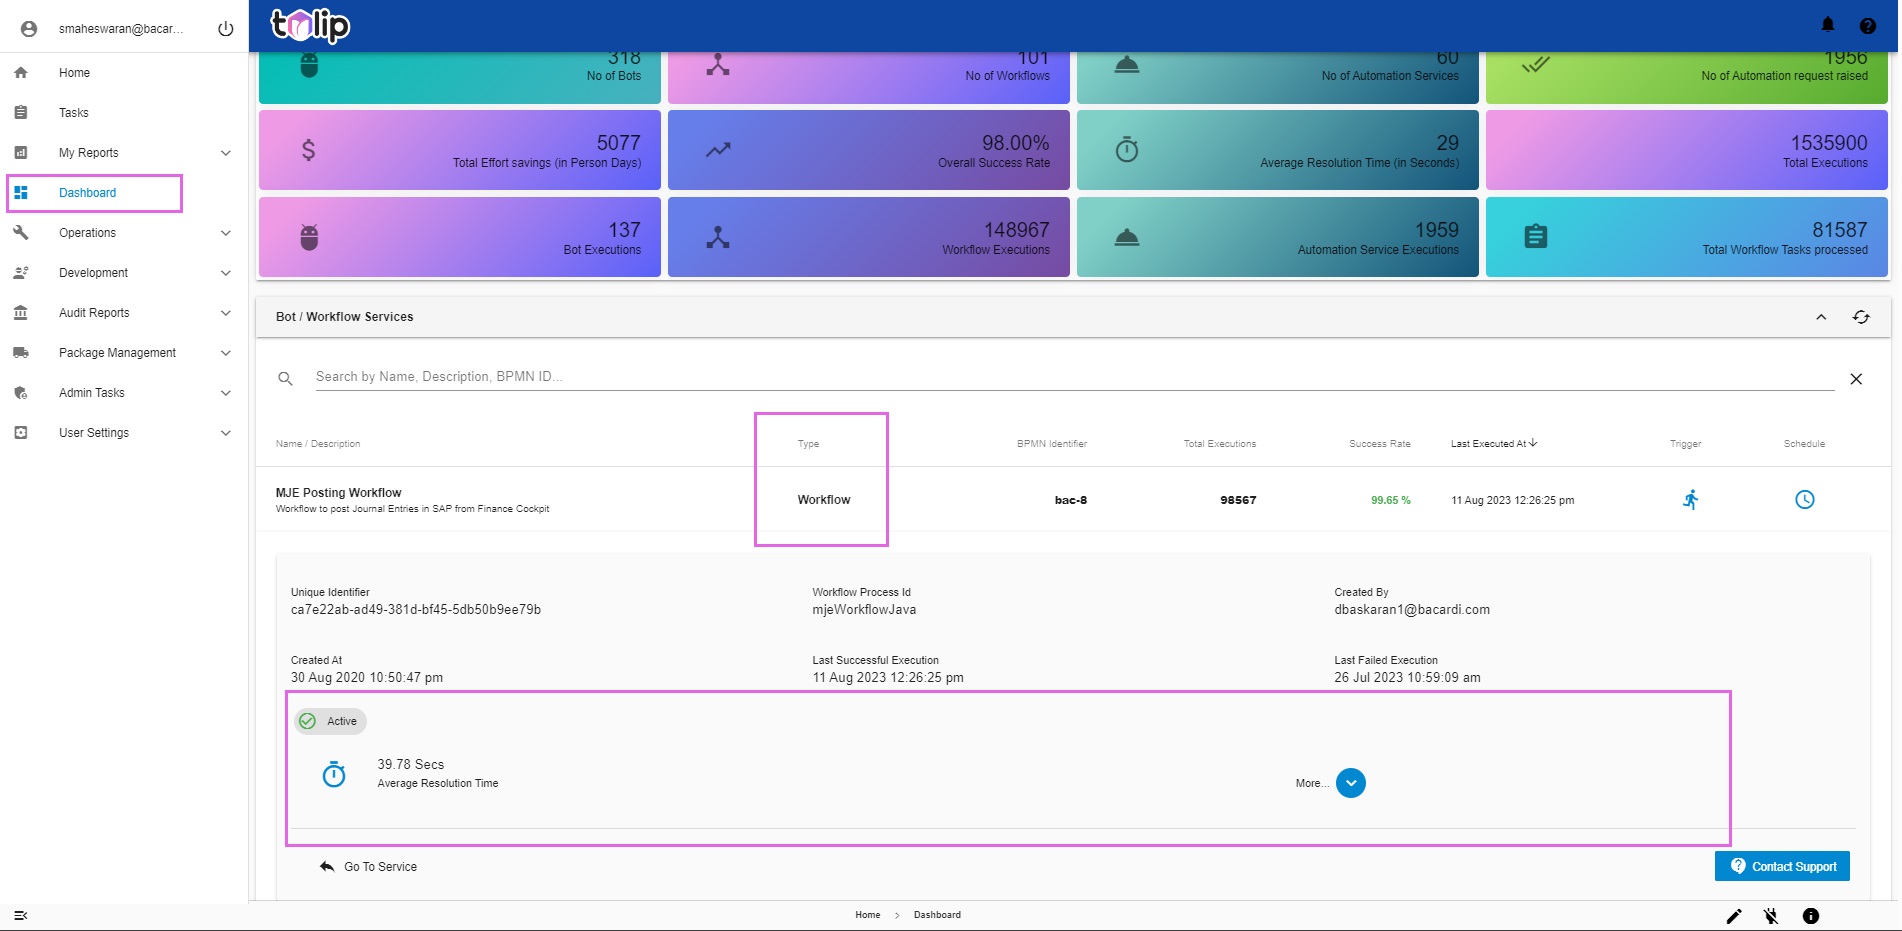
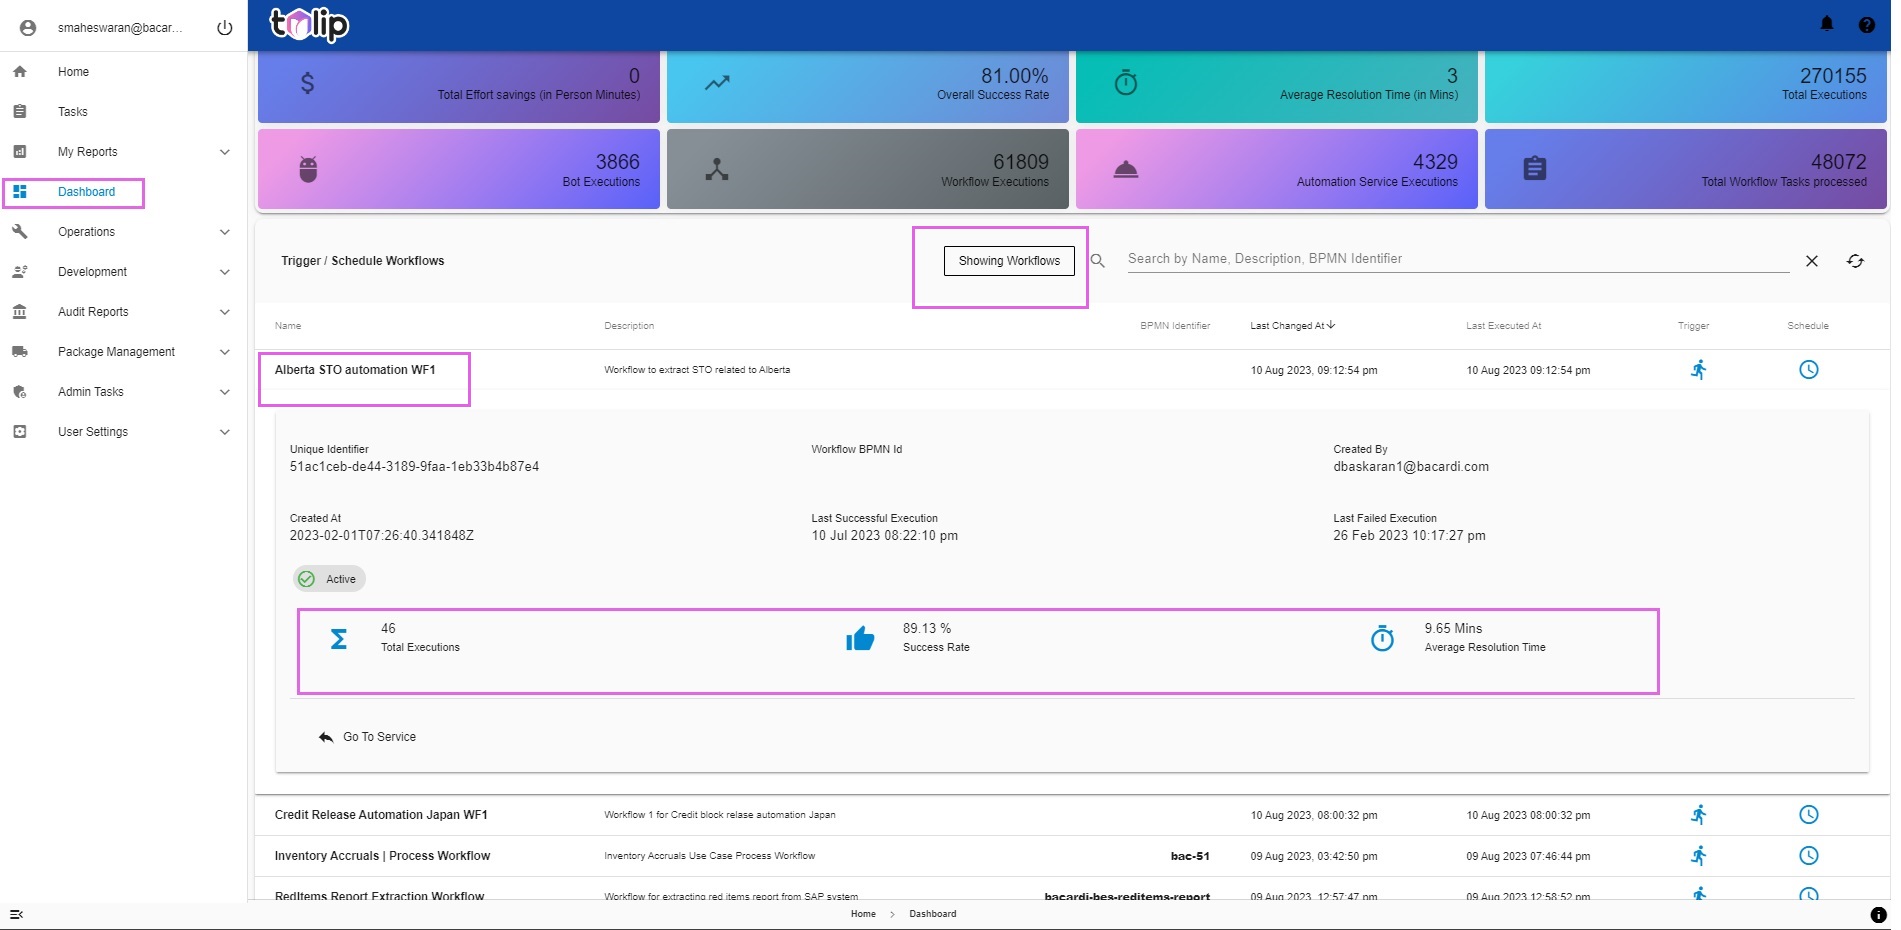
# Dashboard
Let us read on this here and then get in to the changes. Scheduling and Triggering are the primary actions a user can perform with Dashboard. DevOps Leads and Admins primarily use this screen for the same and also for other actions, like viewing the stability of any automation bot or workflow. This version of Tulip gives them more ease at operating this screen with clear demarcation of Bots and Workflows. Other than that, the parameters such as Total Executions, Success Rate and Mean Resolution Time are better viewed in this collective view. By just a glance, the users can get these parameters collated and easily viewable.
| Existing | What's new |
|---|---|
 |  |
# Operations
# Execution History
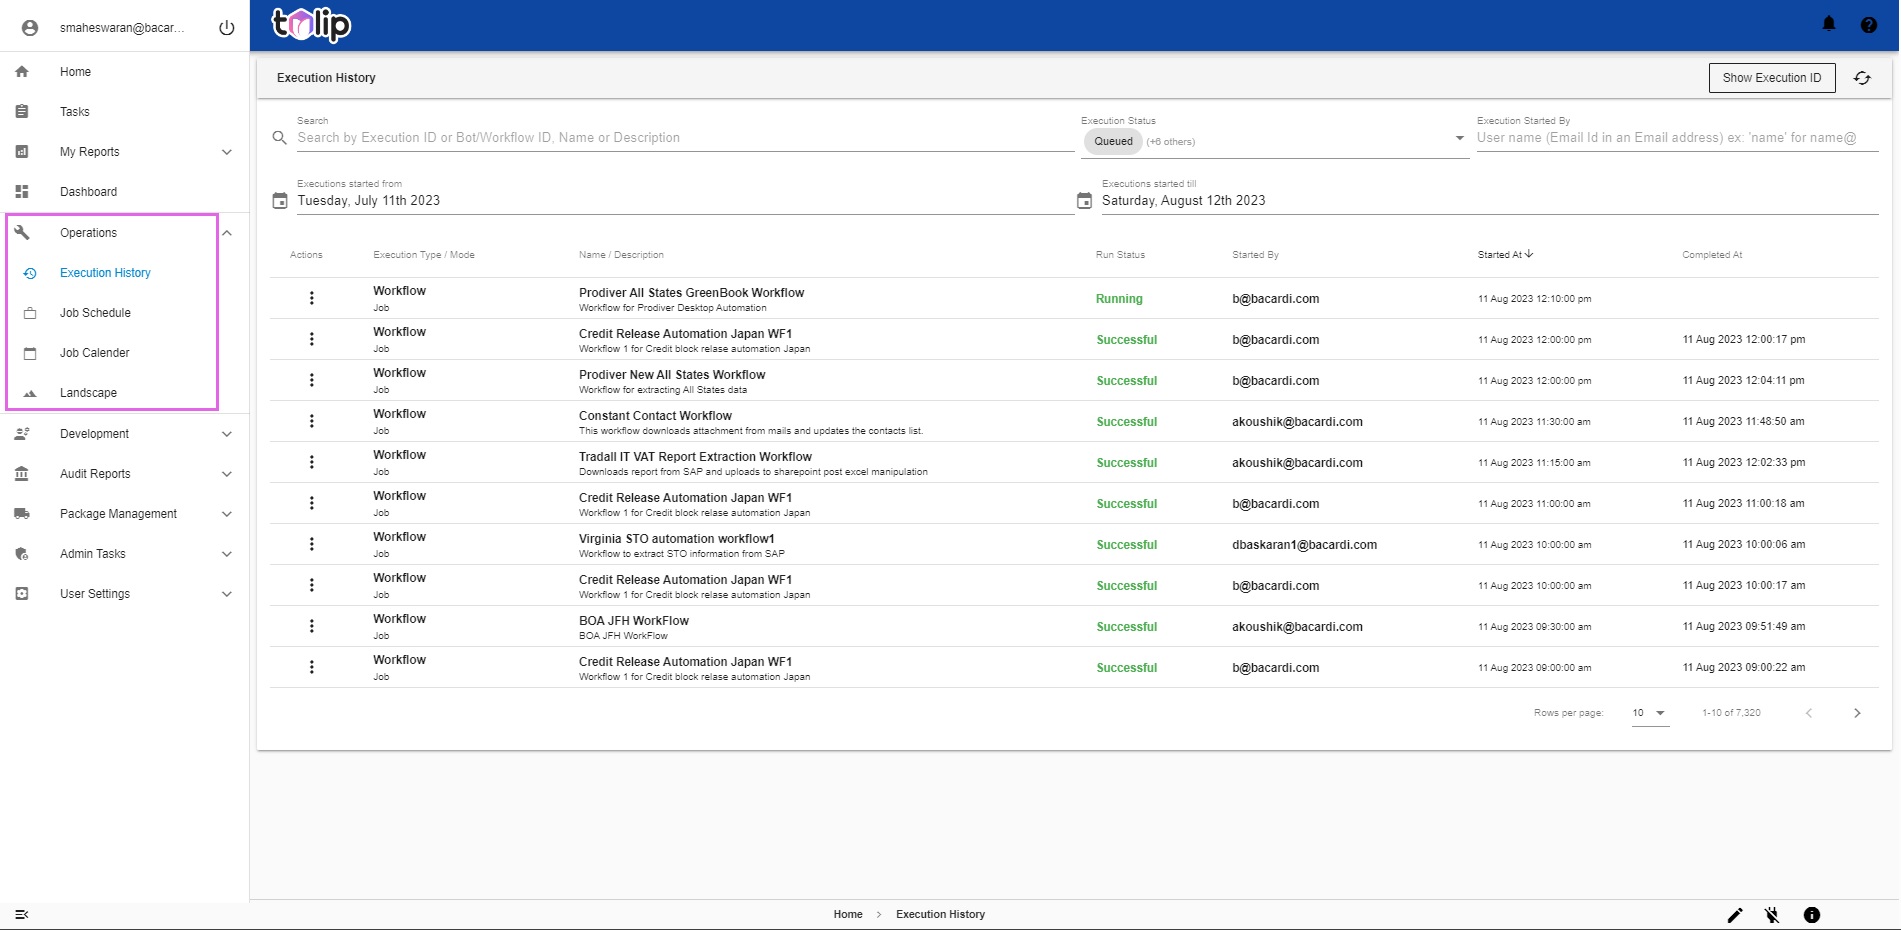
Under Operations, Execution History, by clicking on any Workflow execution, the difference in this version becomes immediately apparent. Before that, we encourage you to read in detail and know the intricacies of this feature here. Don't miss out on clicking the links in that for the How To's. For a direct link, here is it.
| Existing | What's new |
|---|---|
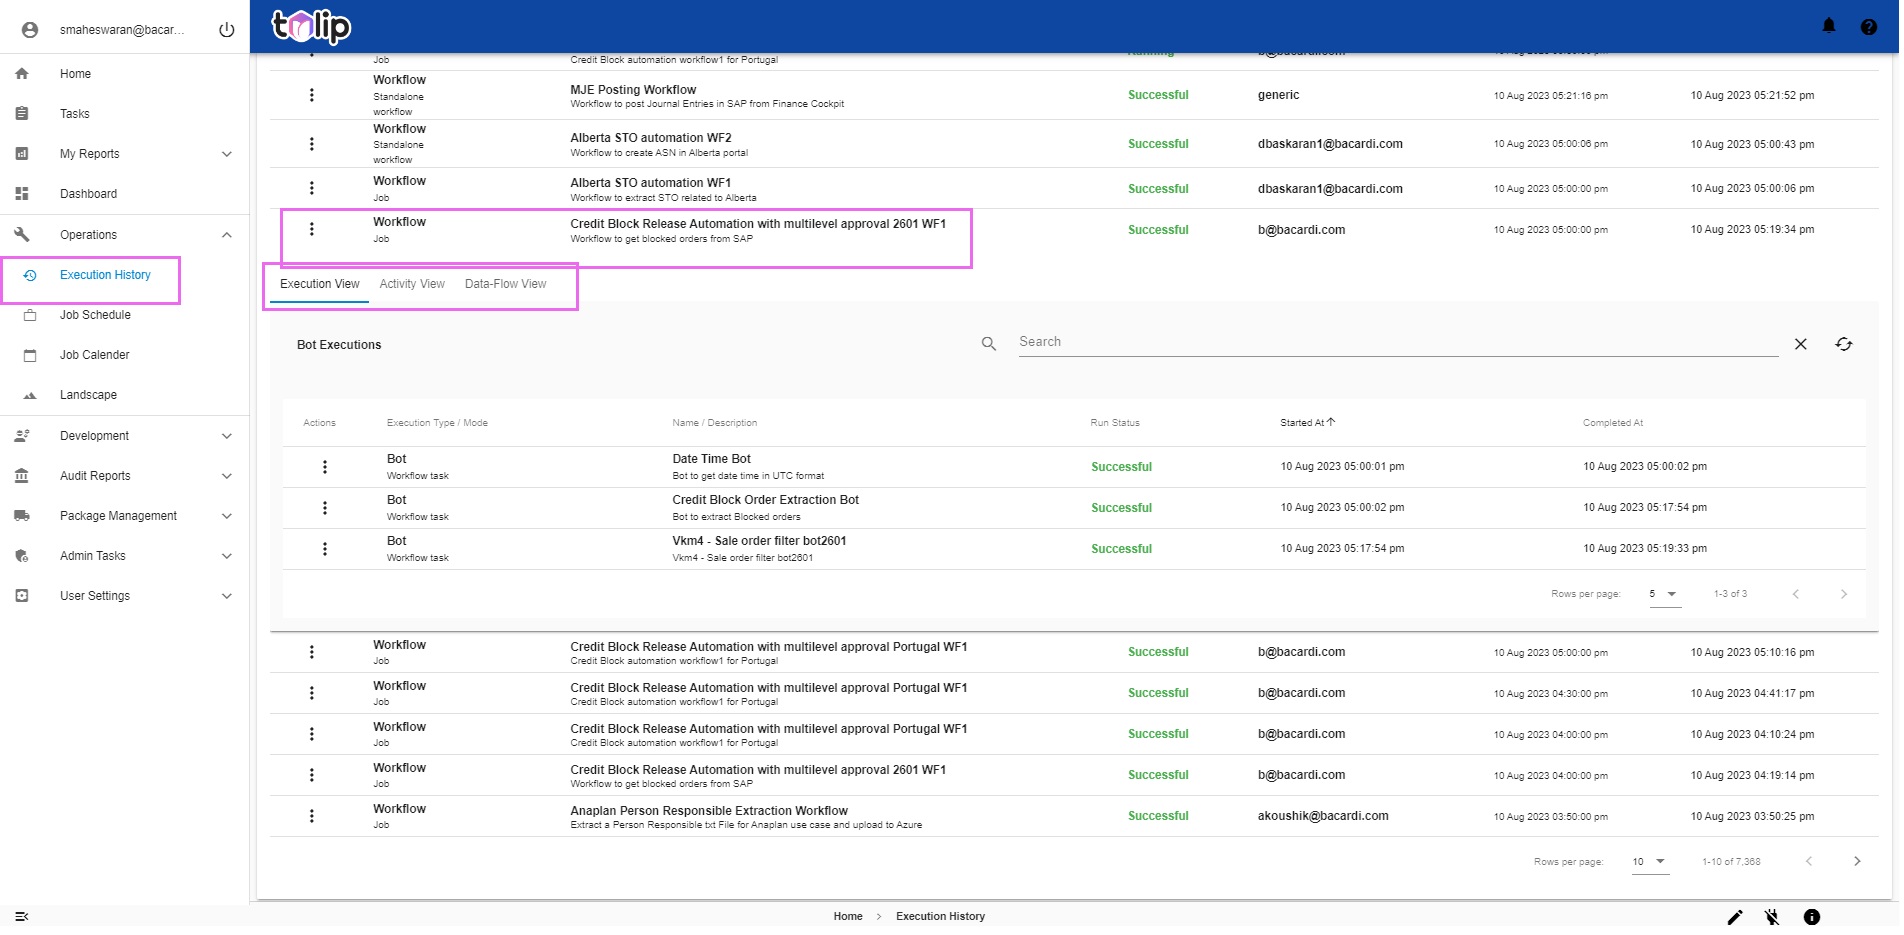 |  |
Dive in deep by clicking on any of the bots in the execution. And voila! Here are the changes.
| Existing | What's new |
|---|---|
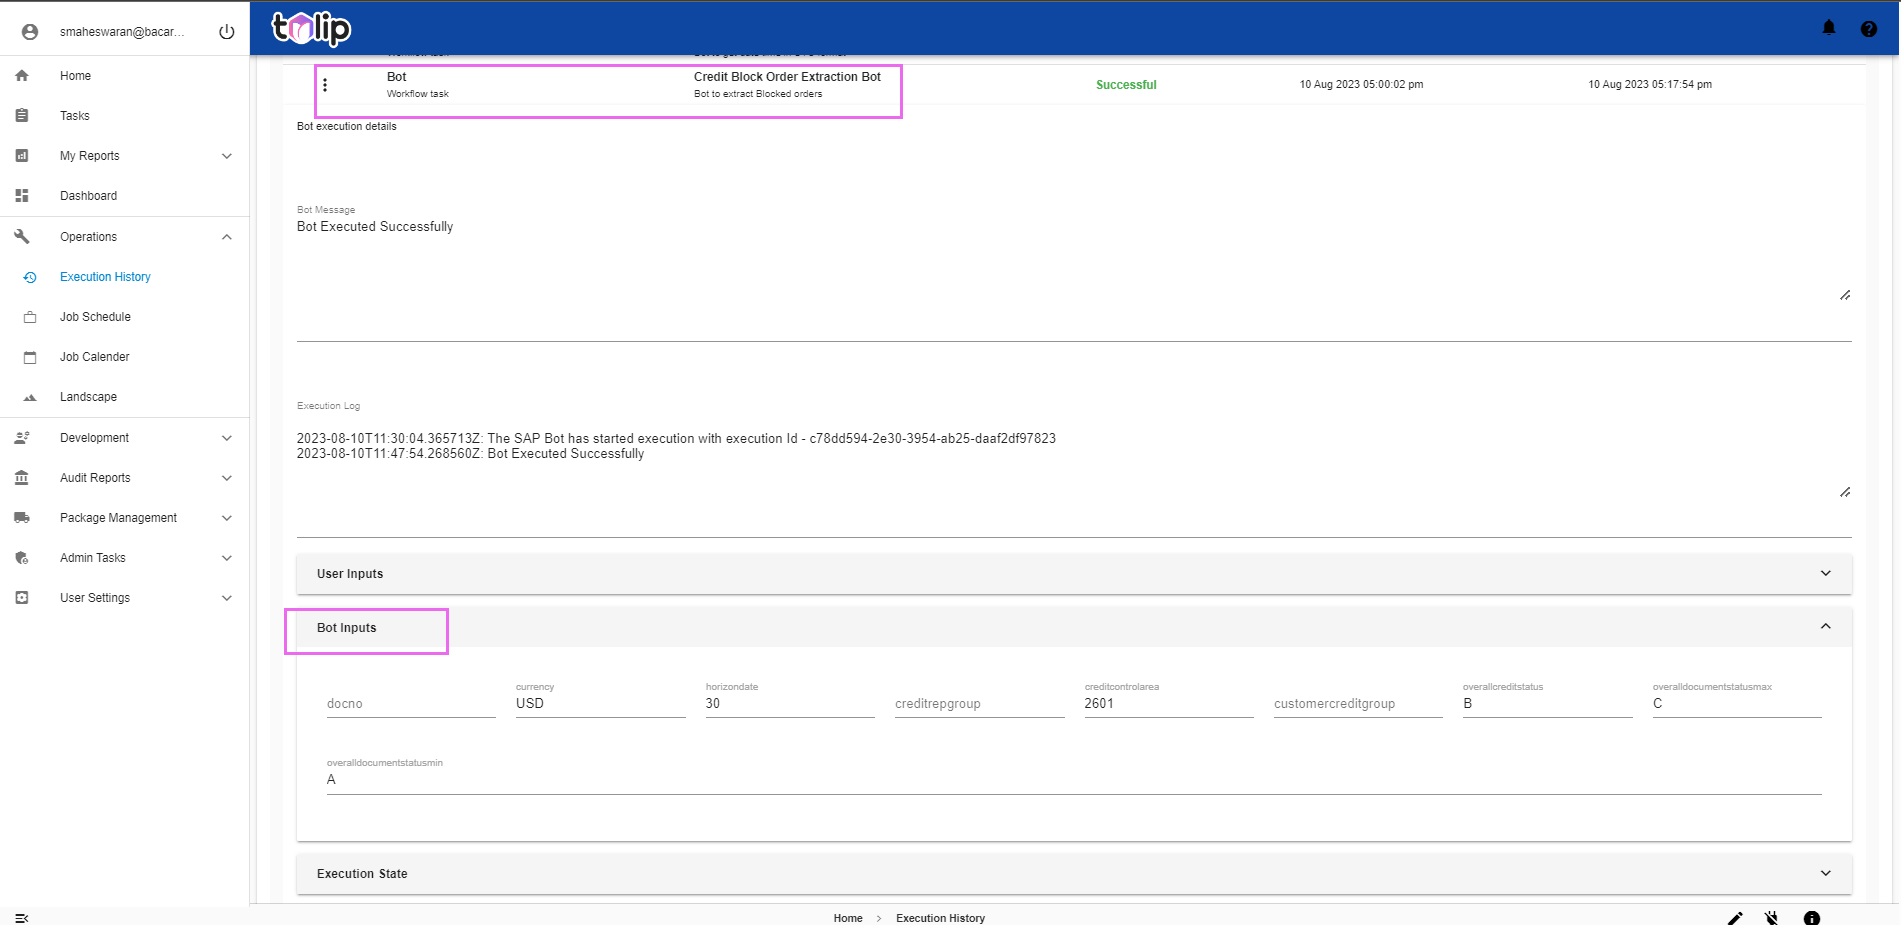 | 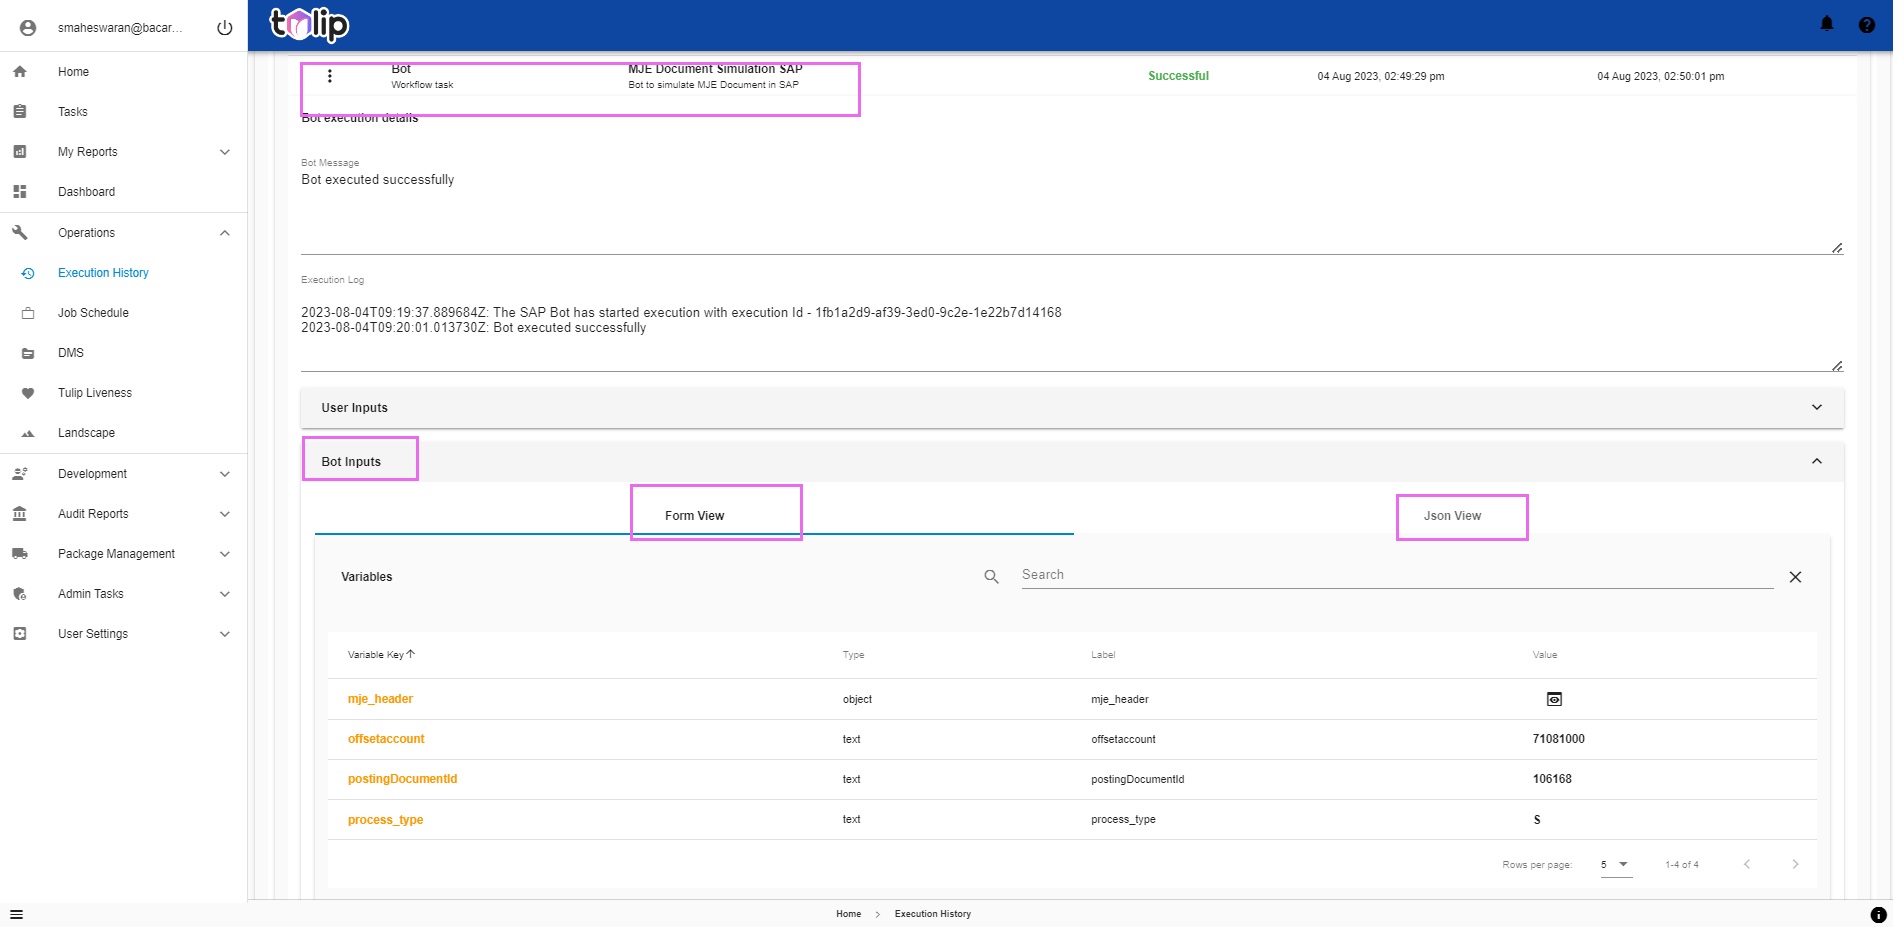 |
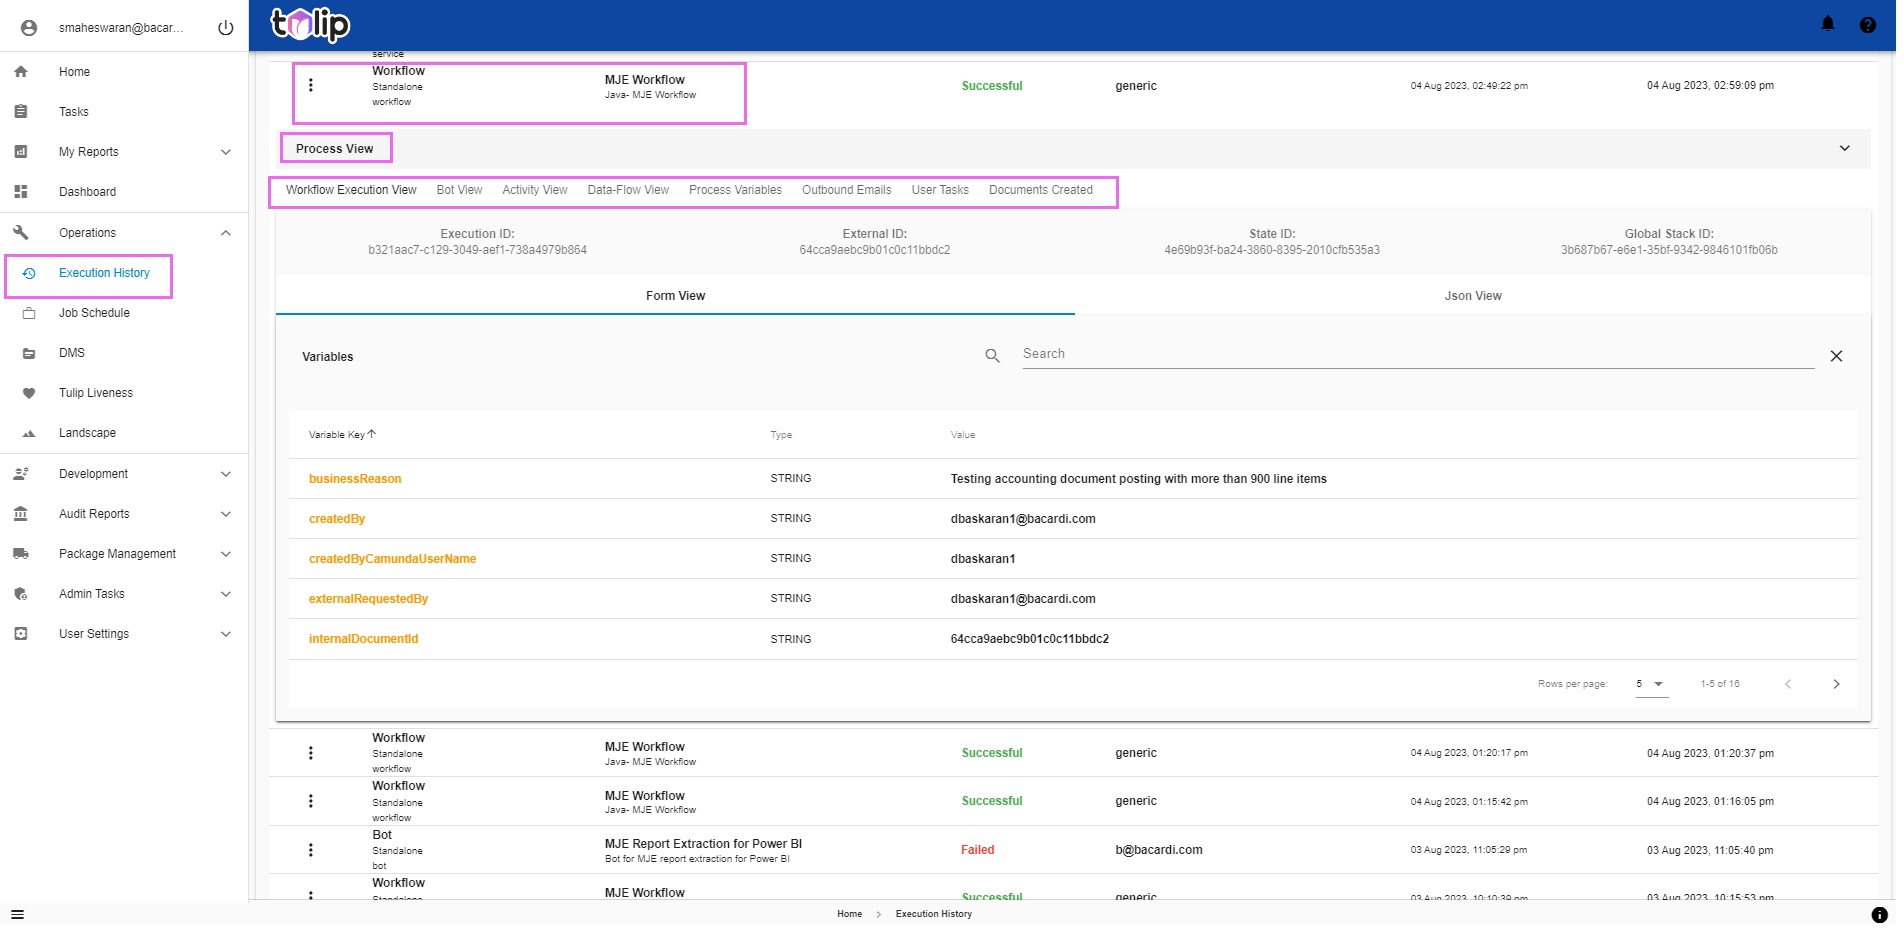
The users who mostly spend their efforts in this section are the Monitoring Role Users who form the first layer of Support activities. DevOps Leads are the other users who analyze the executions or the failures after passing through the first support layer. They must decide on retriggers or other corrections like changing a simple input, etc for course-correcting a faulty execution. This version of Tulip has designed this section with the needs of these two kind of users primarily.
This section serves as a one hub spot for the users to get all information pertaining to the execution - from the inputs parameters, to the execution parameters, to temporary variables created in the due course of execution, to the emails triggered as part of the execution, to the tasks created and assigned and finally the output documents created. Further based on if they are Monitoring Role, they get a read-only access to this data. If they are DevOps Leads than they get to control the execution as well, by retriggering and performing Administrative Tasks. The visibility the different features offer them, enables them to take an informed decision on carrying out their actions.
Disclaimer: If the workflow is a parent-child combination, please note that the User Tasks and Emails Created can be viewed for the execution trigerred. Ex: The Parent workflow will have its own details and the child workflow will have its own details. Most cases are that the Child workflow only has Emails created and Tasks generated, as part of the workflow design. But the Documents Created section aims at showing the Documents created both for the parent as well as the child workflows associated as part of it within the Parent workflow itself. Also, for the Documents Created to reflect the documents, the automation has to pass the same as variables. Stay tuned to this section to view the Documents created for each automation service one by one on an incremental basis in the upcoming releases.
# Job Schedule
Let us read what this is before proceeding any further. Click here. Also a direct link for your pre-read.
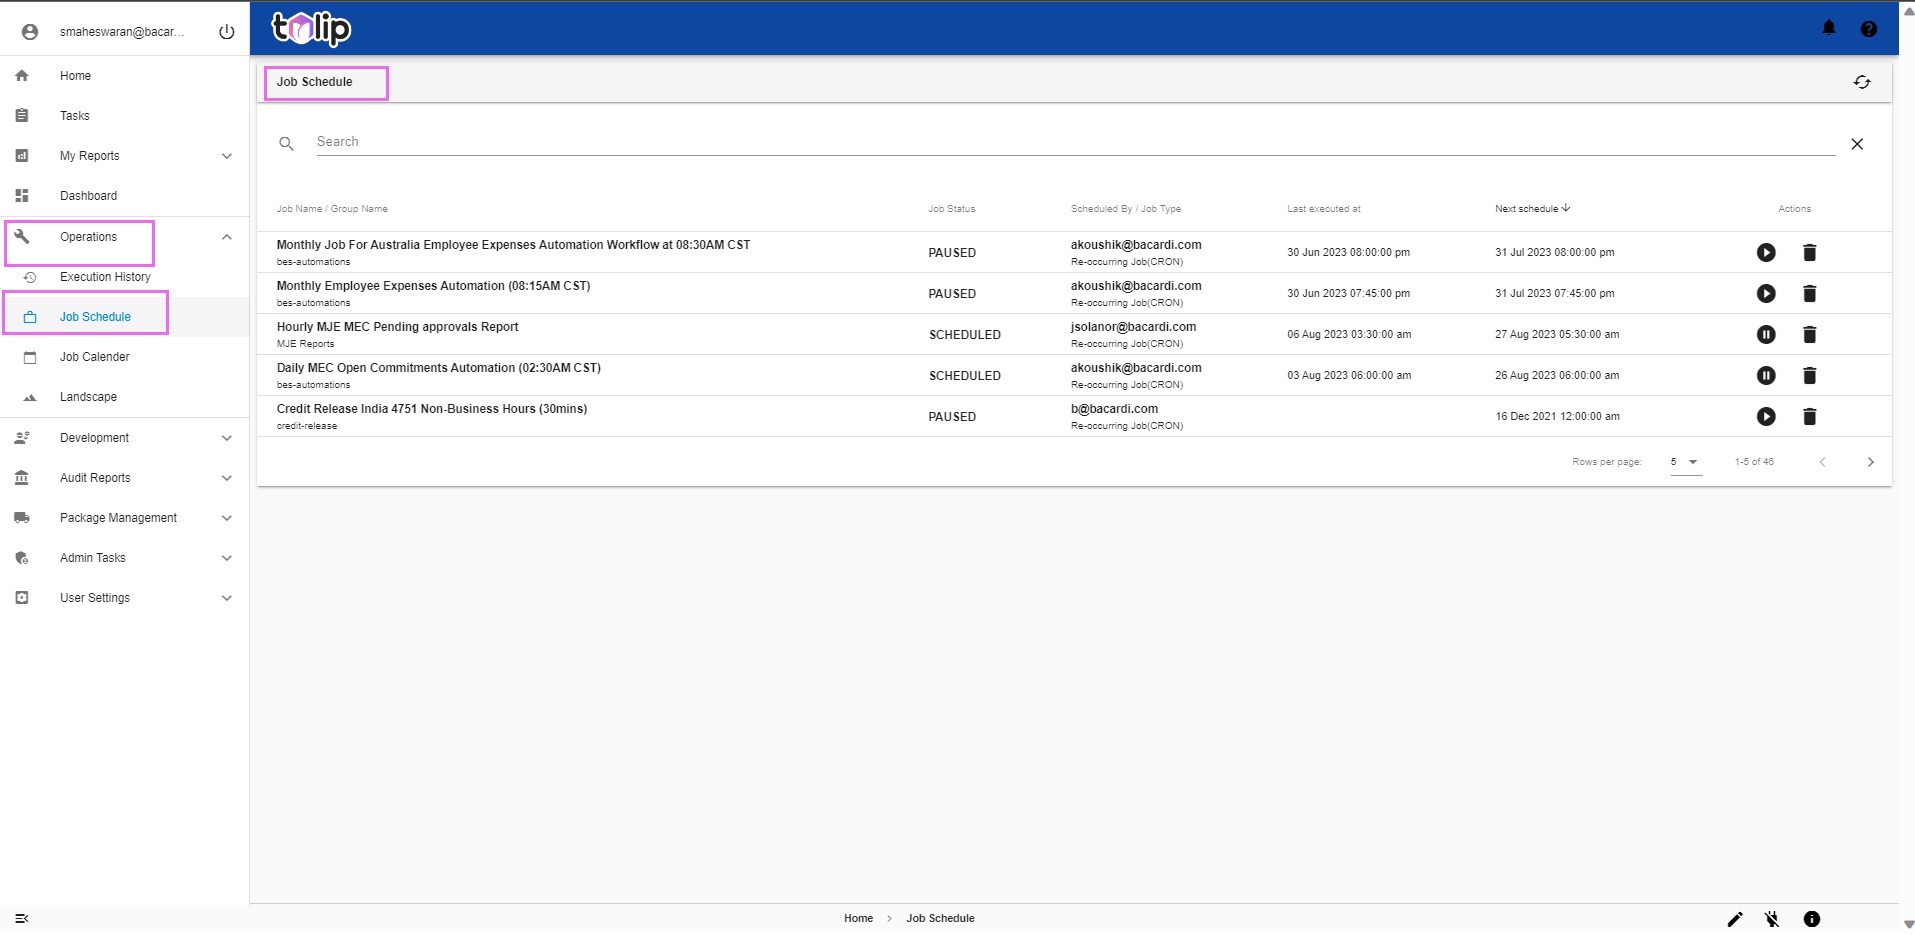
In Operations, Job Schedule, the below is the difference between the existing version and the new version.
| Existing | What's new |
|---|---|
 | 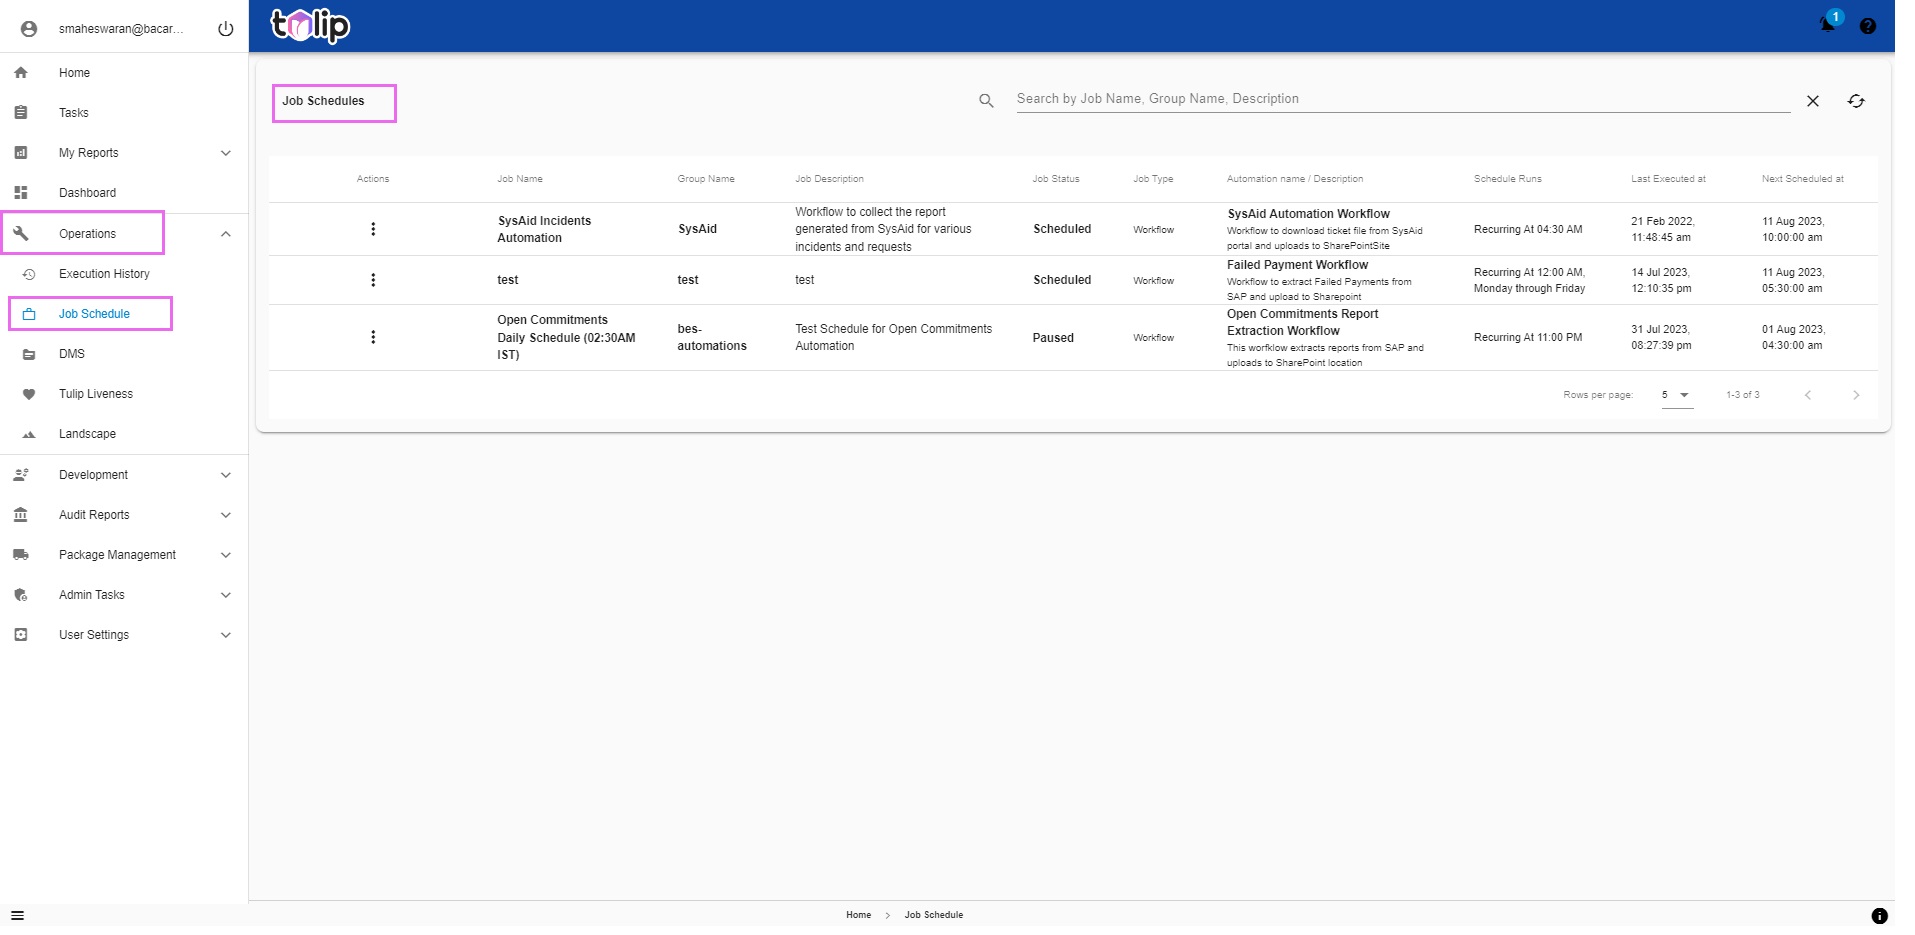 |
Click on any of the scheduled jobs to get a contrast between the level of data visible and usable by users.
| Existing | What's new |
|---|---|
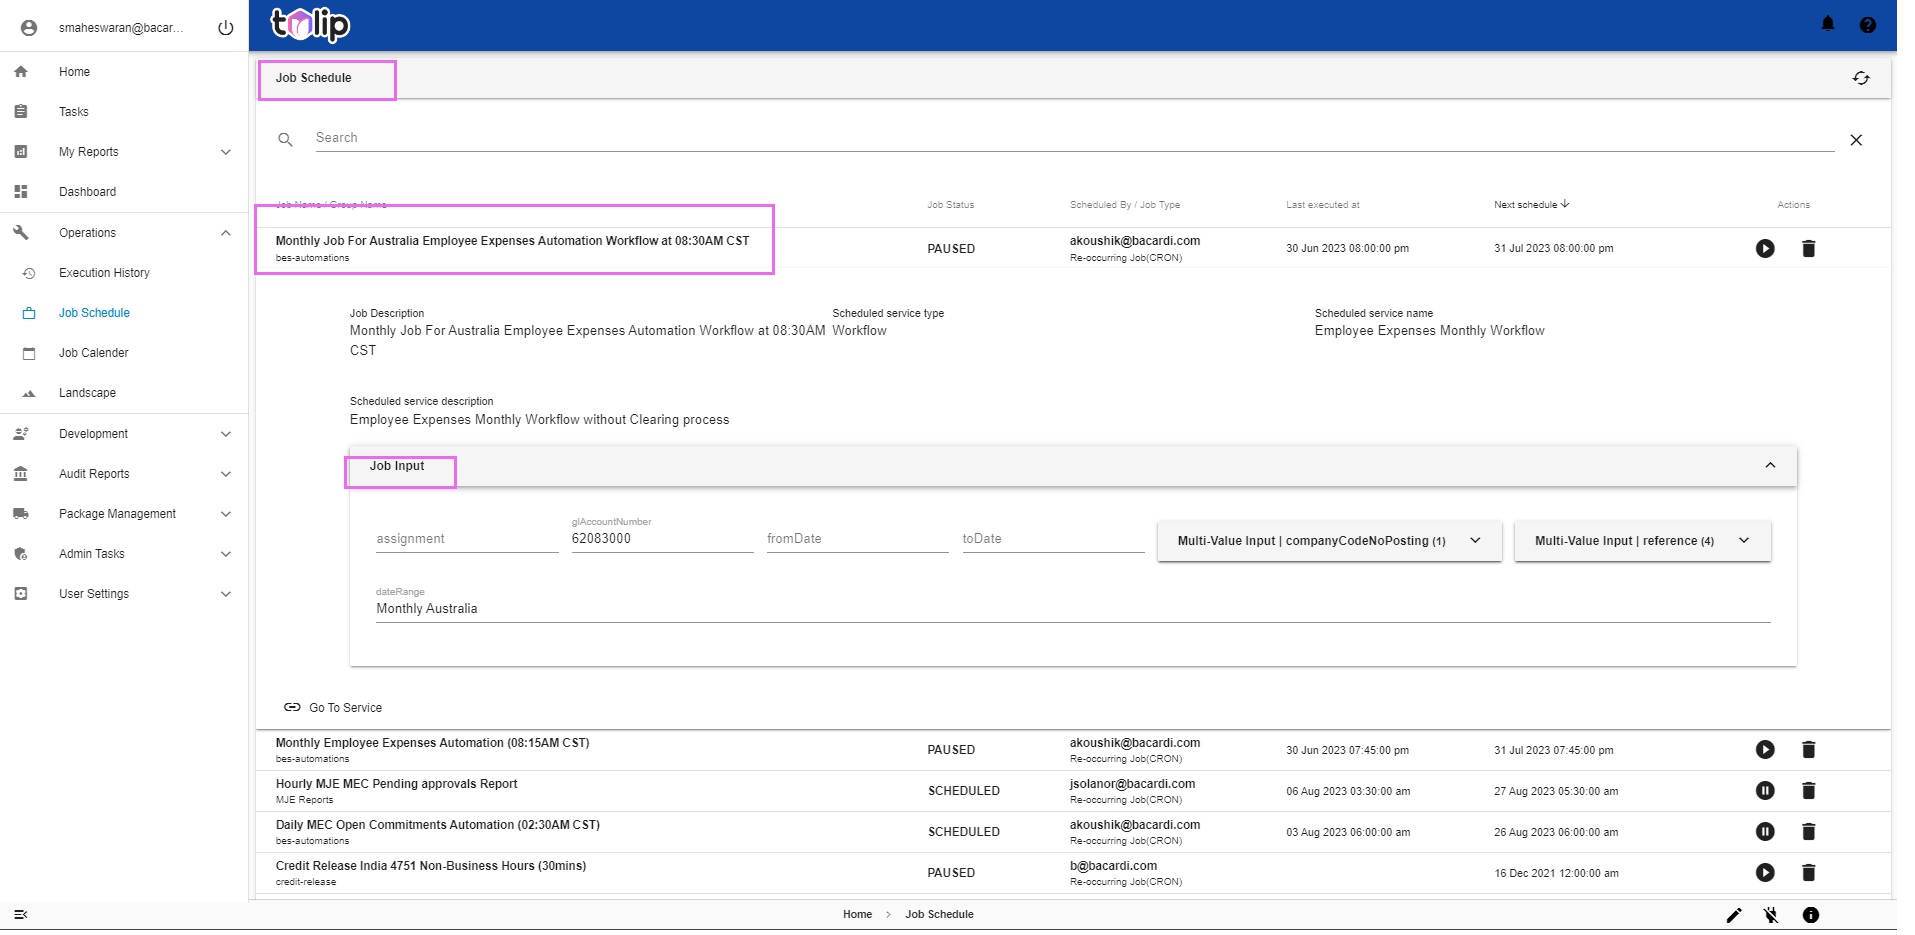 | 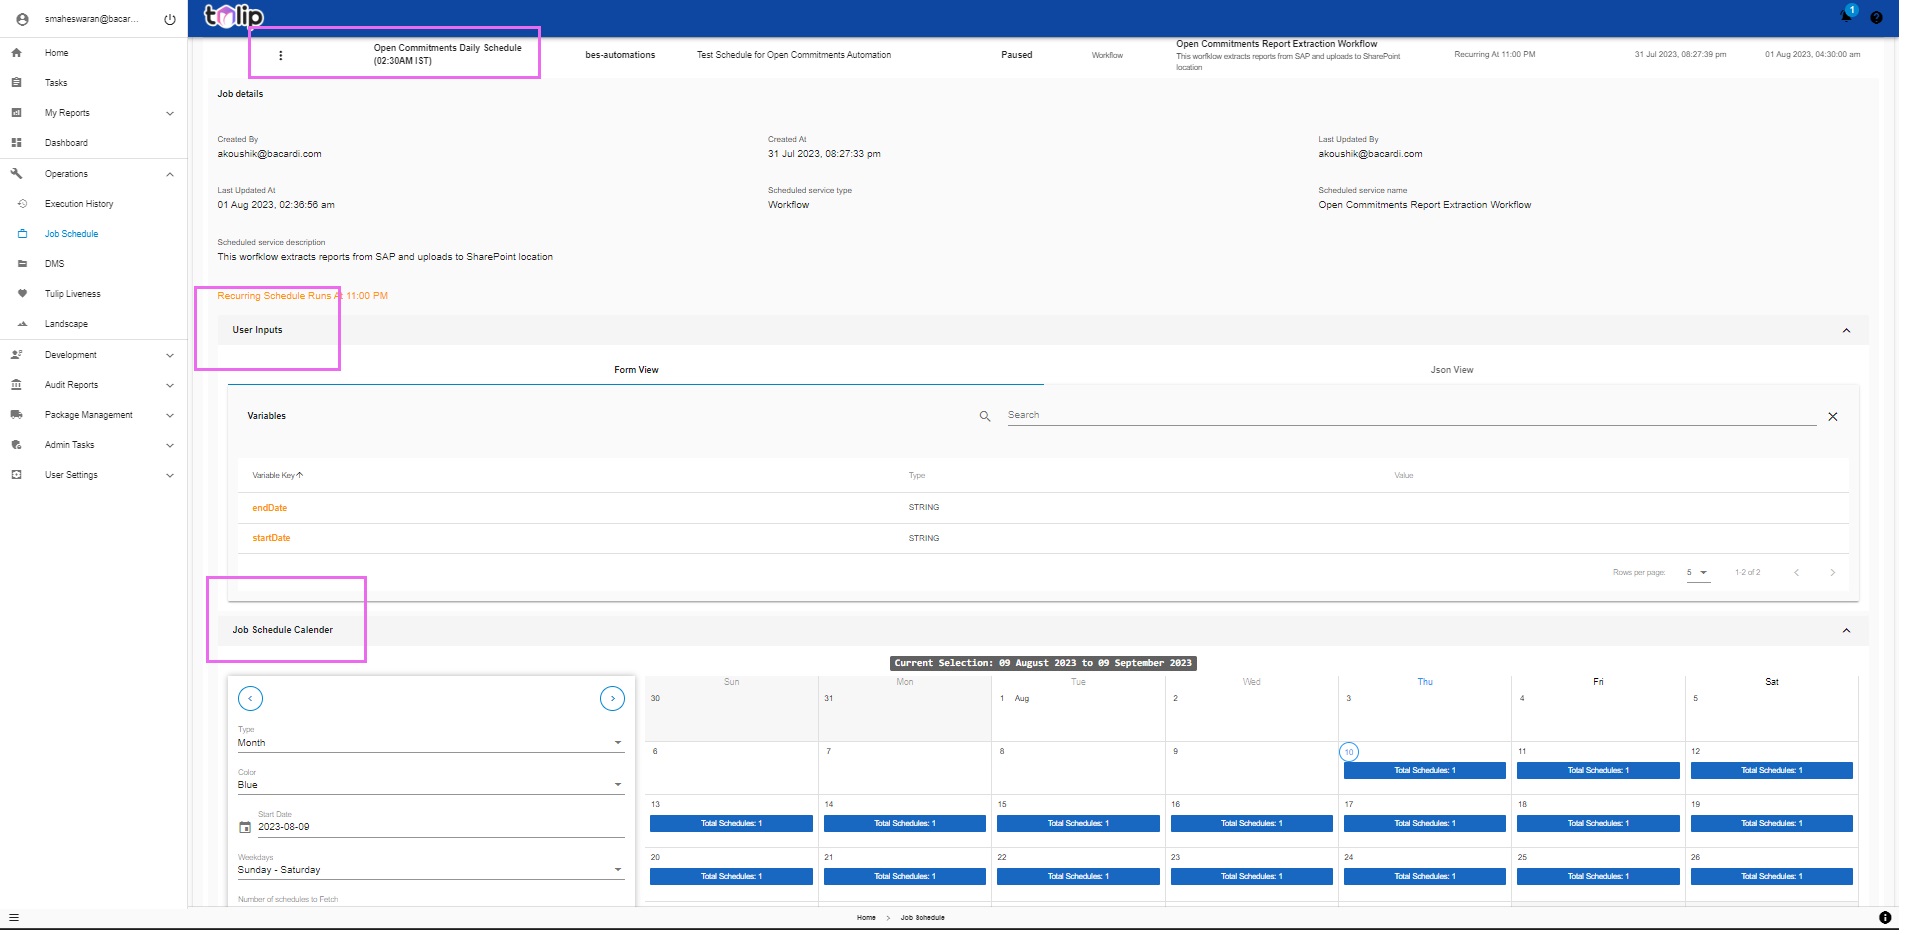 |
DevOps Leads work often with Job Shedules, in order to view schedules, change schedules, pause jobs, force stop running jobs, etc. With this new version of Tulip, the aim is to make the process of scheduling and working with schedules much easier and user friendly. And consolidation of the entire information including the inputs the job takes as a parameter. And we leave it to you to analyze which view offers it better. We give it to this new version of Tulip.
# DMS
An entirely new feature on Tulip, we urge you to read on this.
With just the DMS file signature, you can easily download the DMS file. This would be very useful for DevOps Leads when they are trying to analyze the reason for any failure, and they wish to look at the uploaded/downloaded files by the users. Instead of looking at the logs and identifying the locations on the Production VMs, they can now just get the file in a click. How easy it becomes now to analyze the inputs/intermediate process files!
| Existing | What's new |
|---|---|
 | 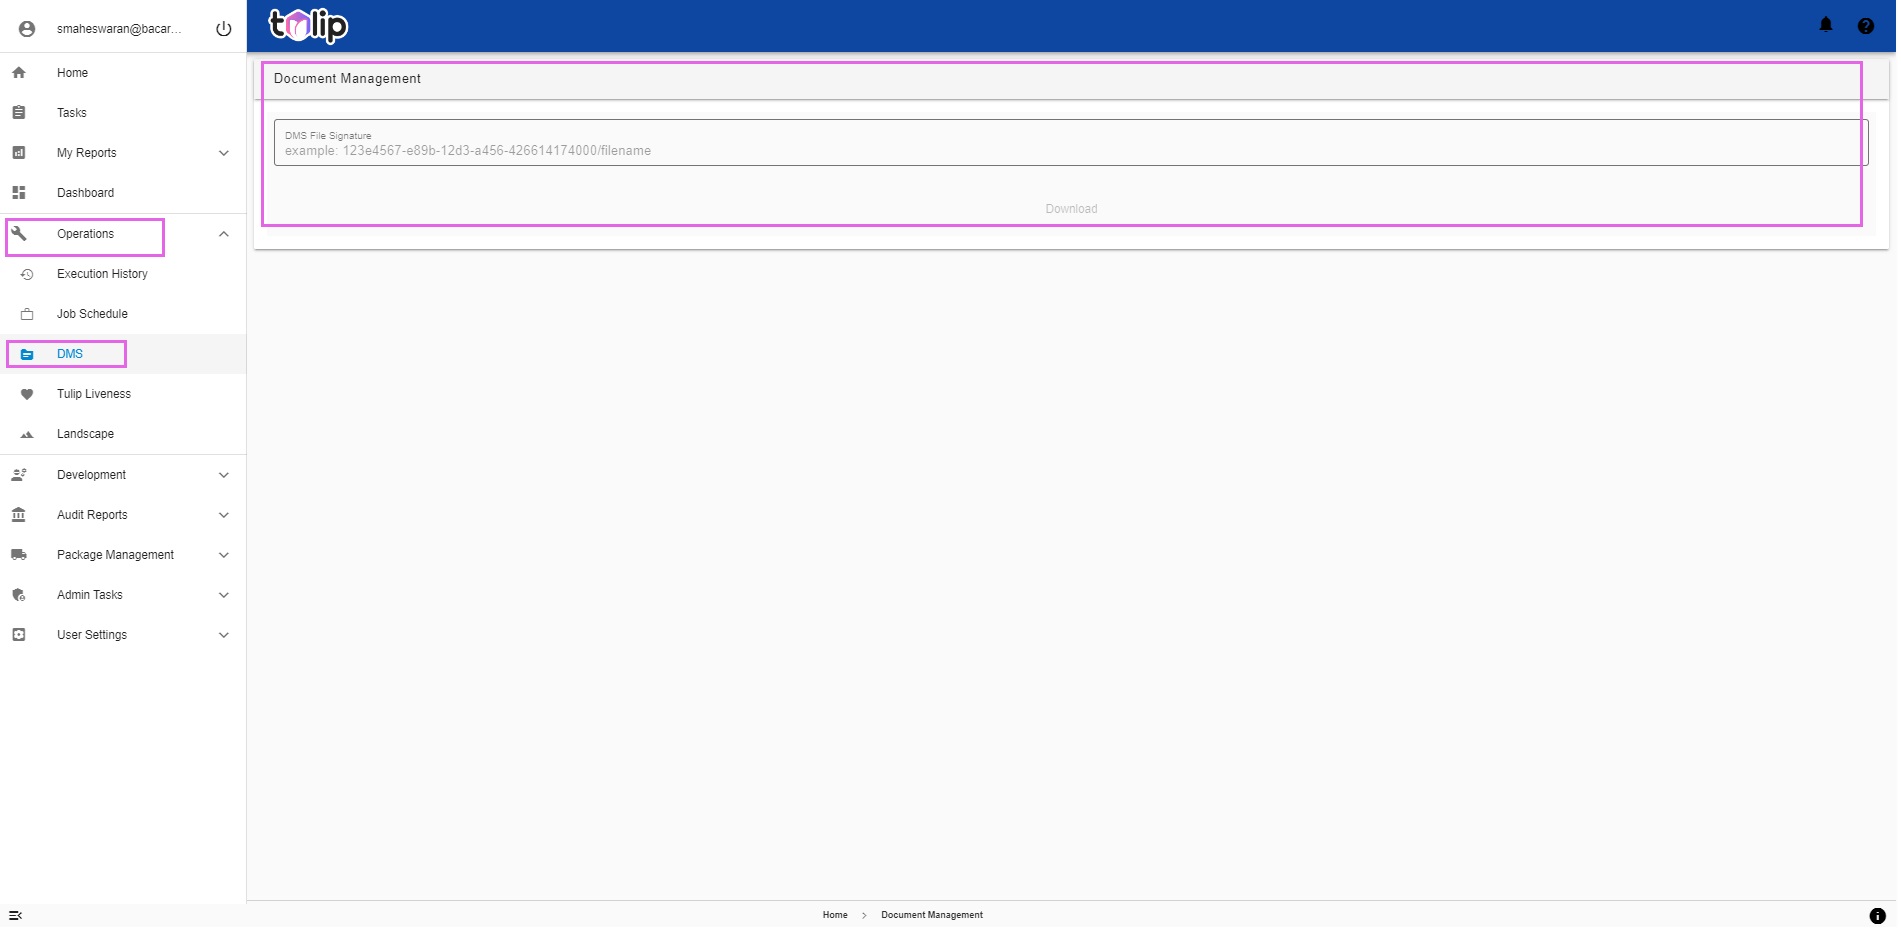 |
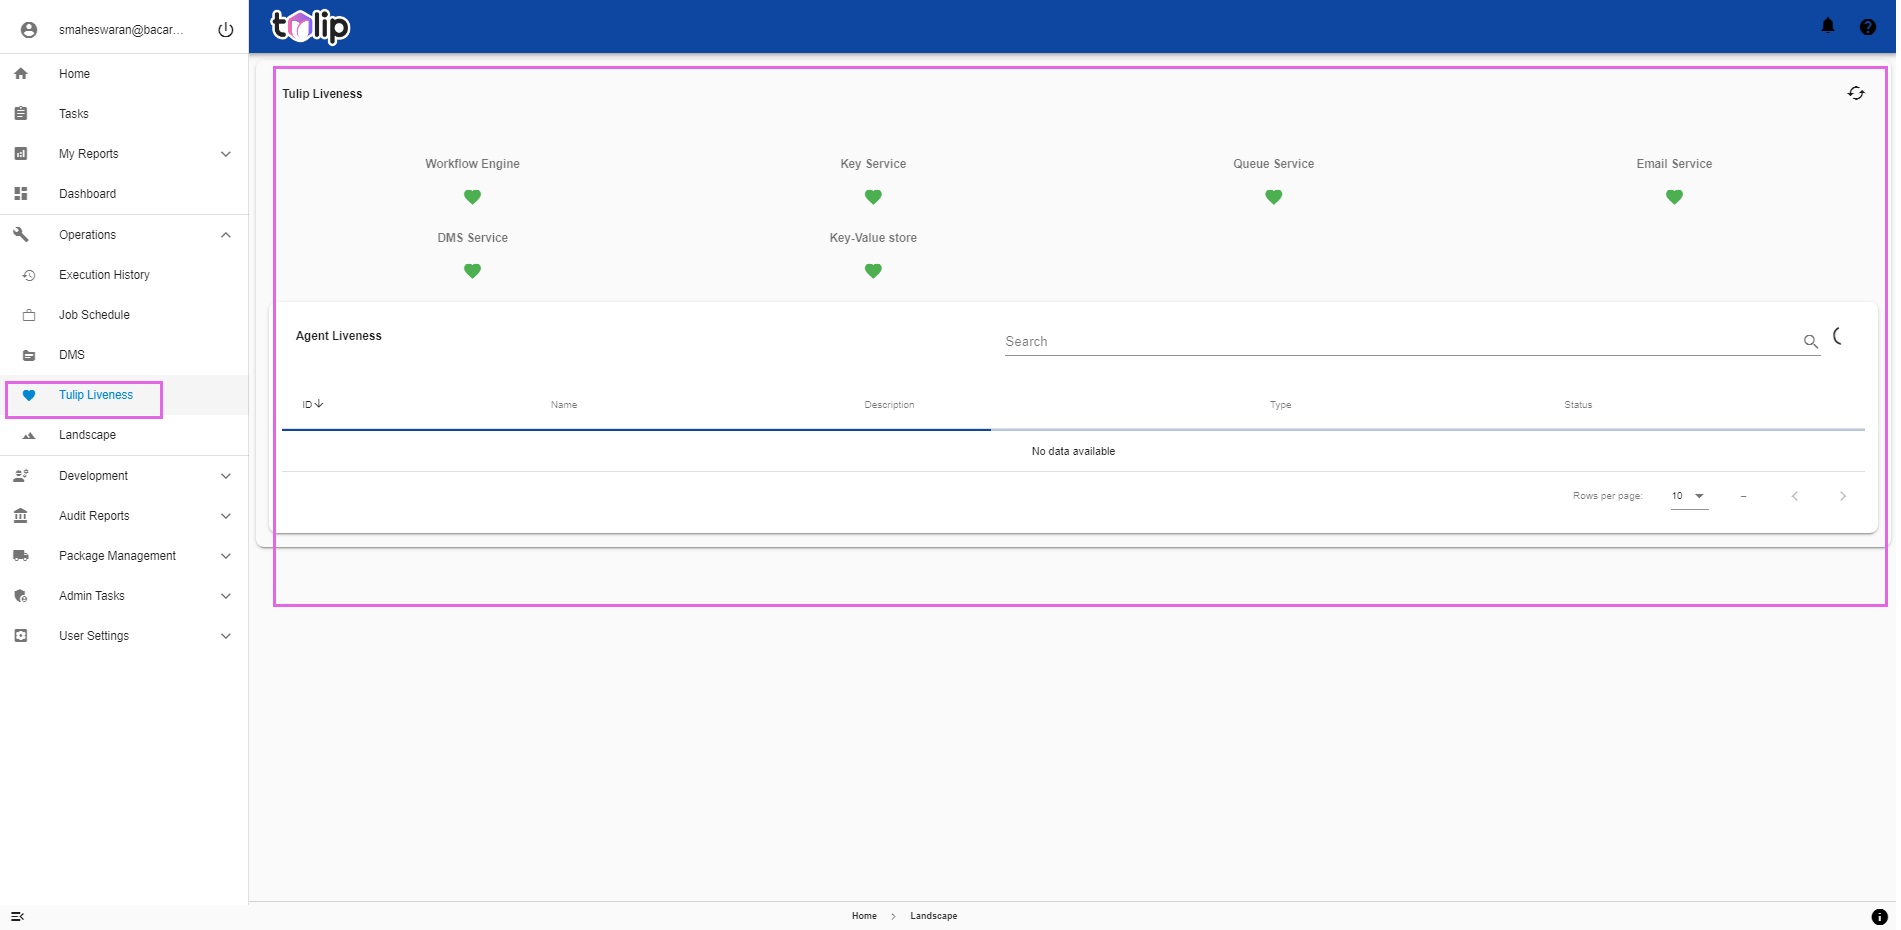
# Tulip Liveness
A total boon to the Monitoring role users and also to the Admin users is the feature of Tulip called Tulip Liveness. Let us take a quick look as to what this is here.
Troubleshooting becomes very easy, as the users have to just check the liveness of each component of Tulip and the integrated systems, to ascertain if any is down. In the case that any is down, all that is needed is a boot up of that down component. This improved overall visibility in to the healthiness of Tulip at any instant is what makes life simpler for a Monitoring Role user, is what we claim!
| Existing | What's new |
|---|---|
|  |
# An Example Execution
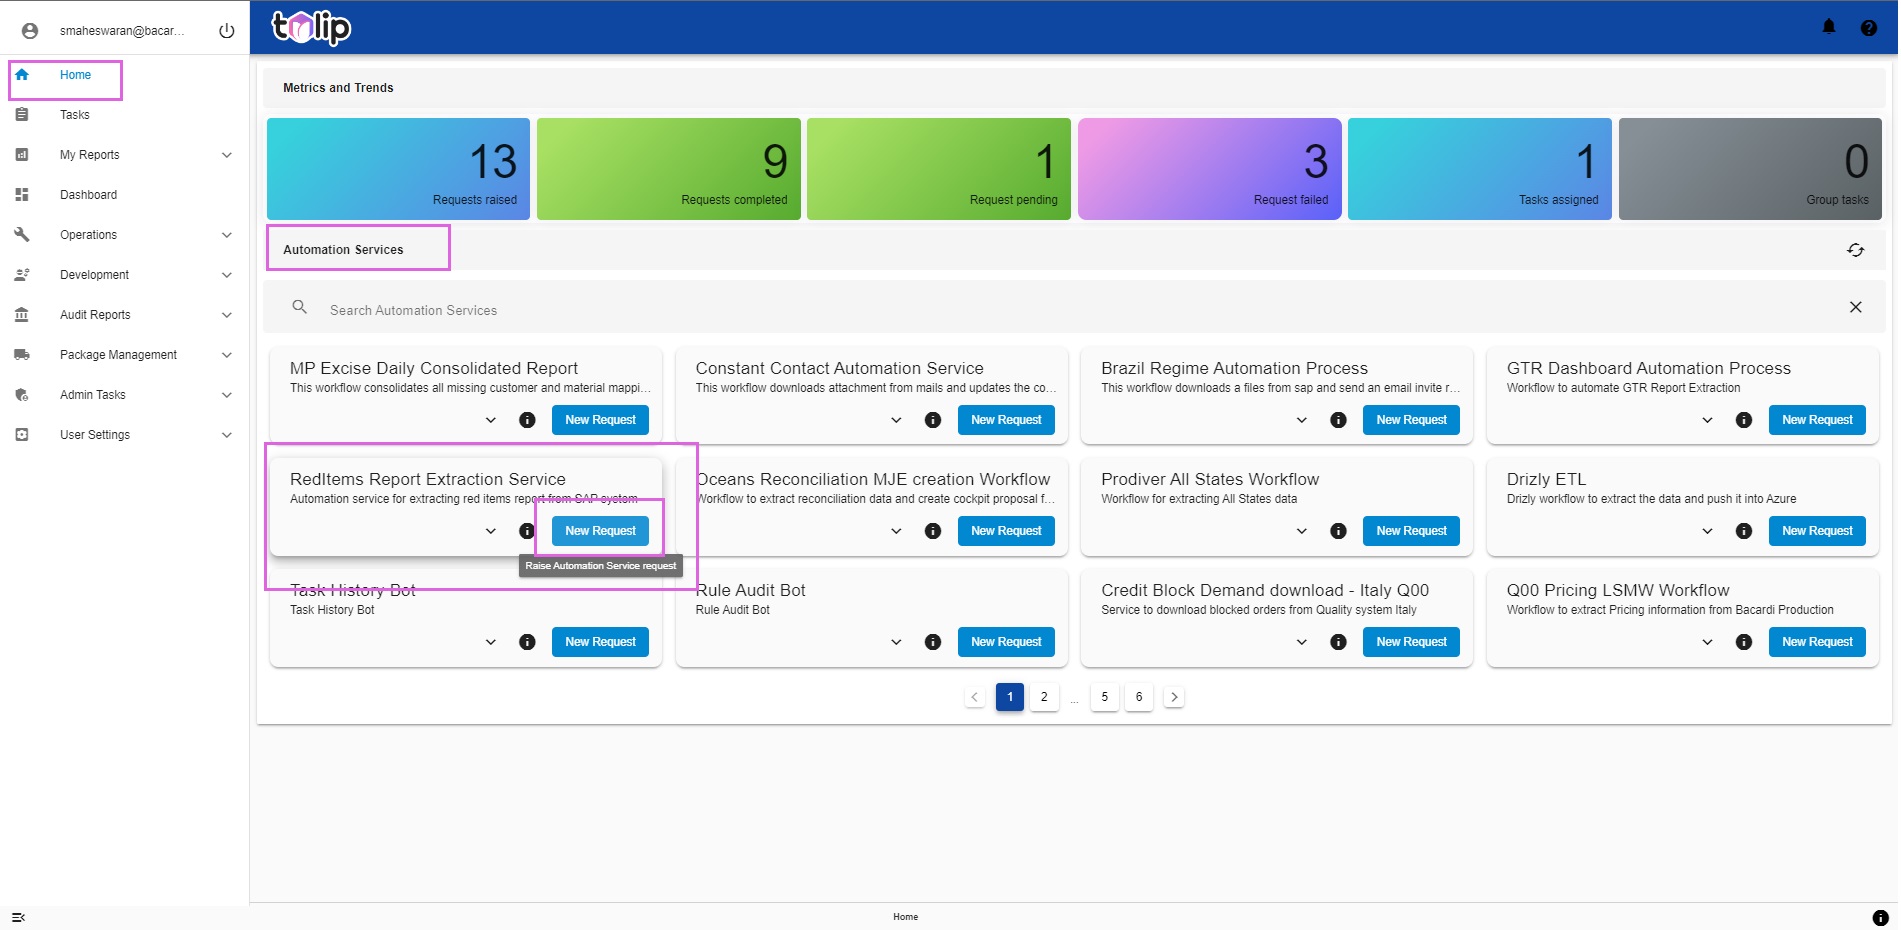
Let us consider raising an automation service request as an example.
On Home, under Automation Services, select the service to be executed. Click on "New Request".
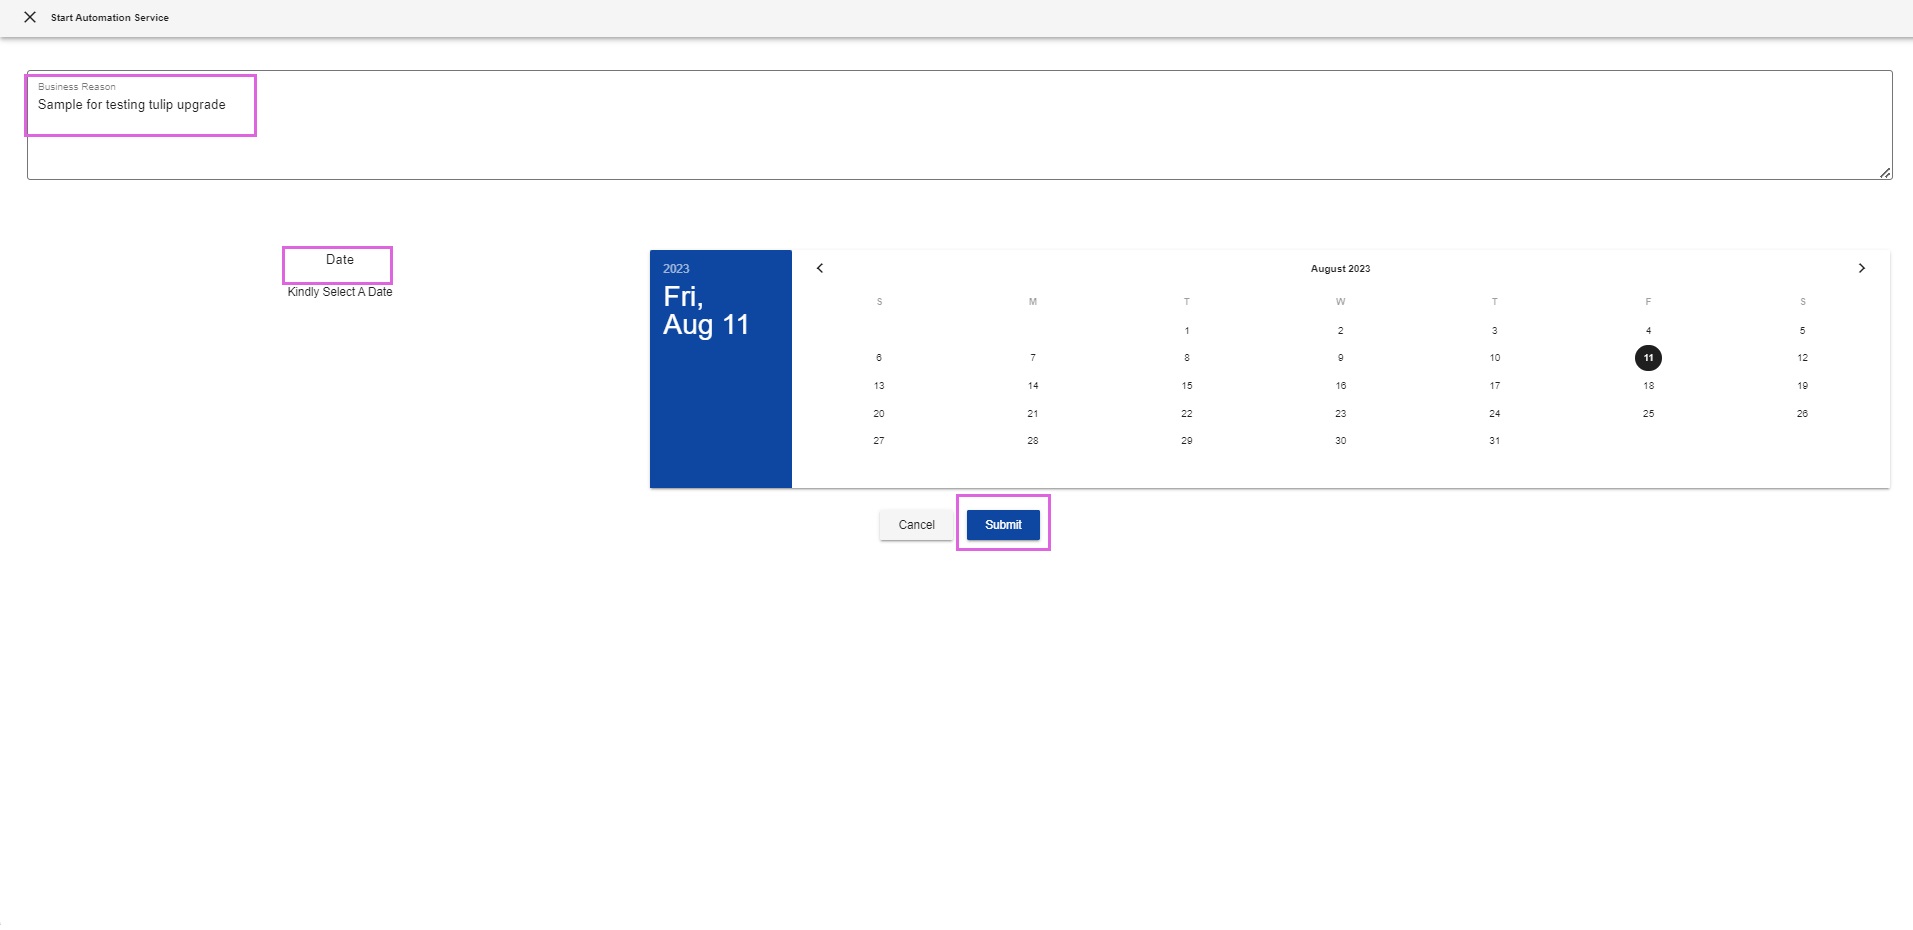
Provide the user inputs and click on "Submit".
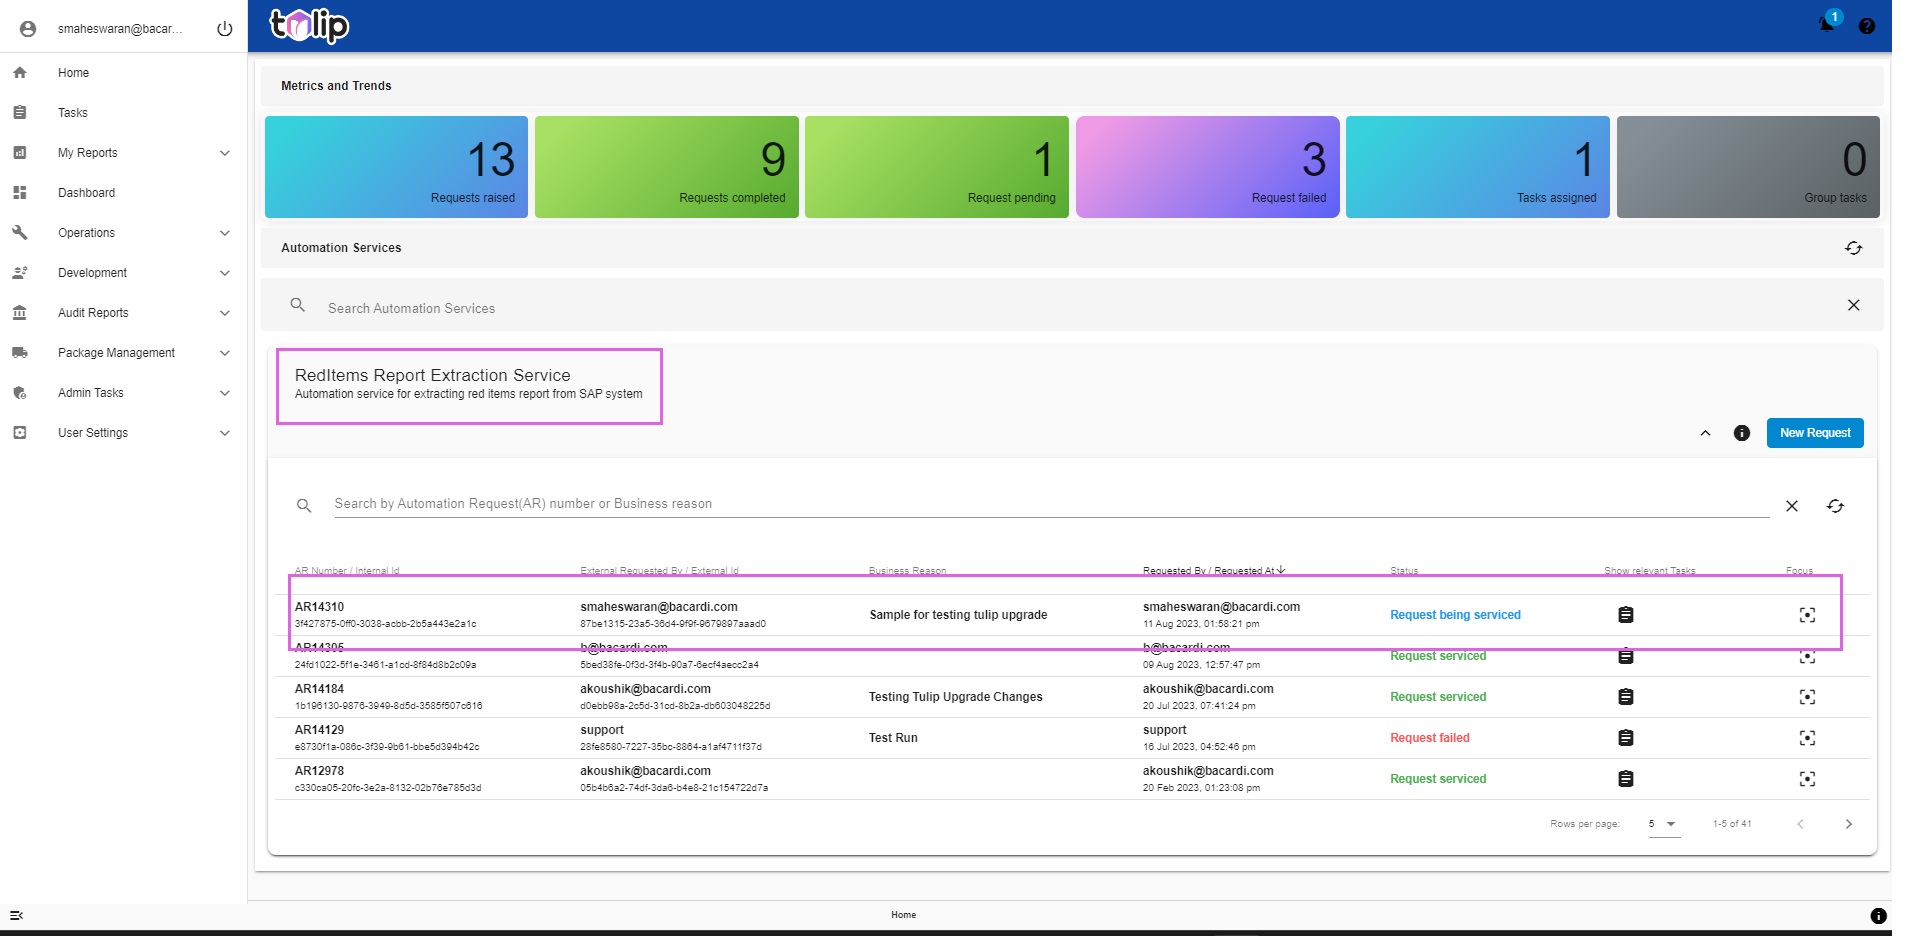
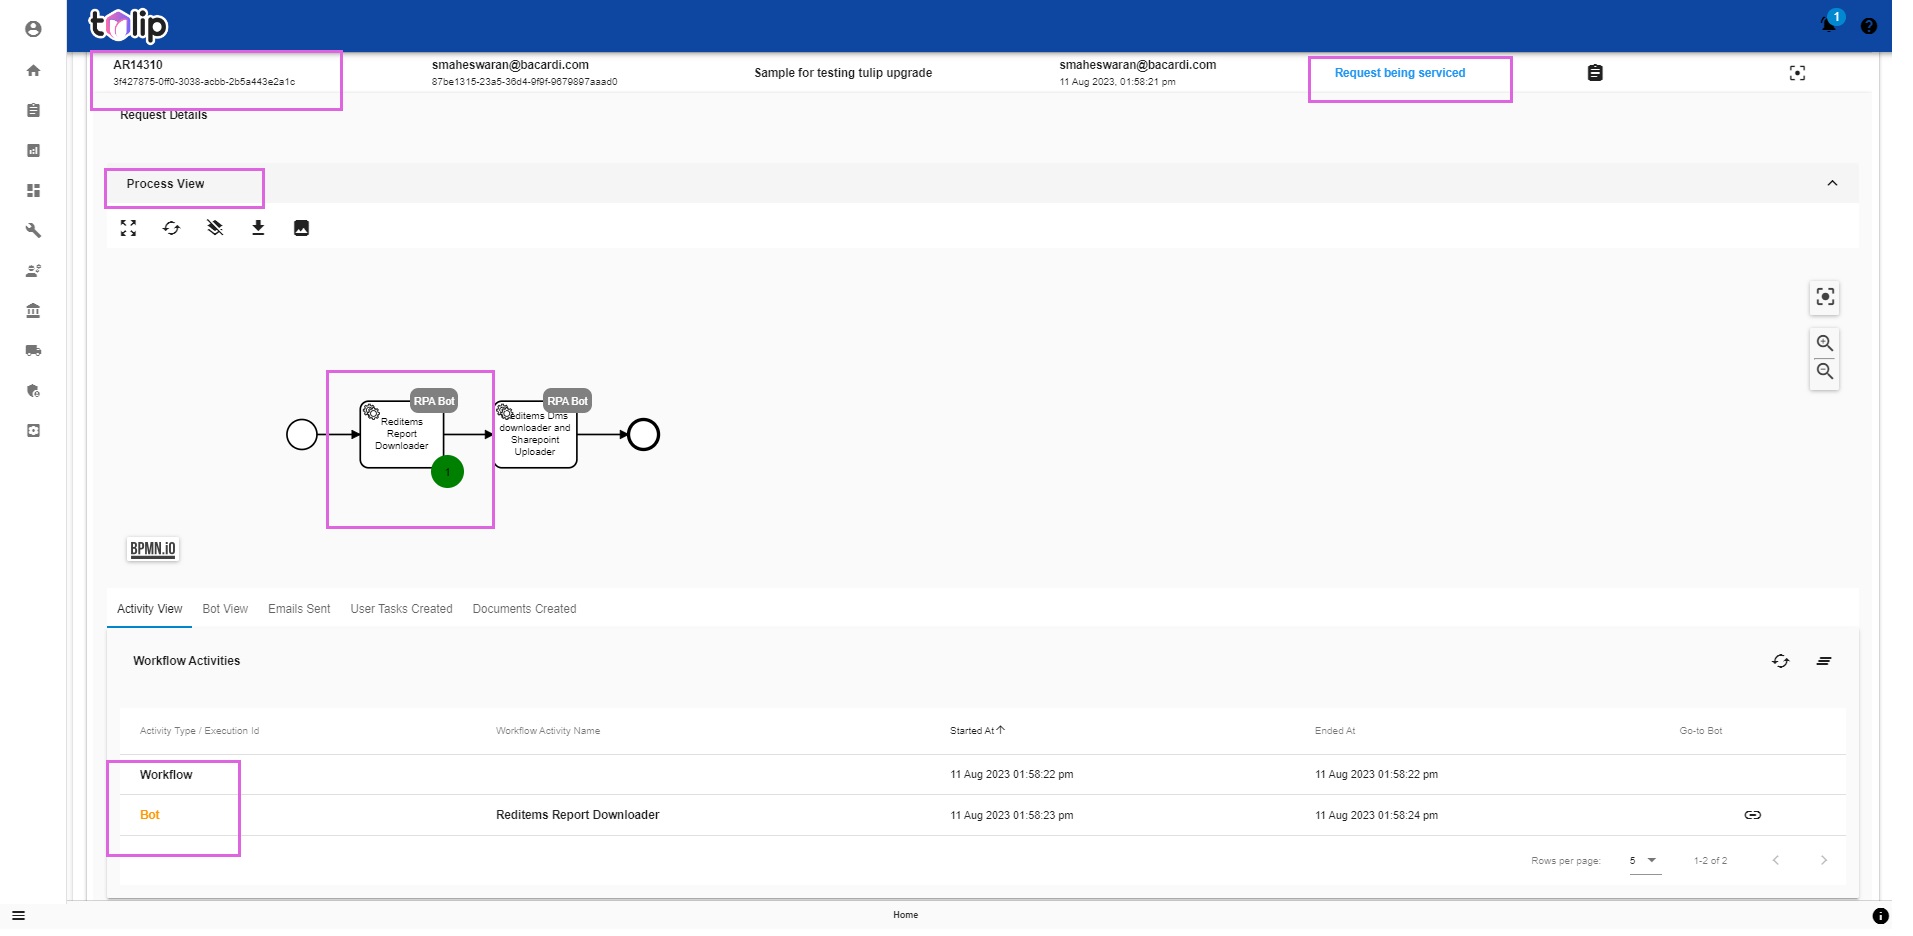
By clicking on the Service, you will be able to see its status as "Request being serviced".
Expand the Process view to see the flow of execution. You can track the Green dots. At this stage, only the first bot has executed. You can also see the Activity View reflecting the same.
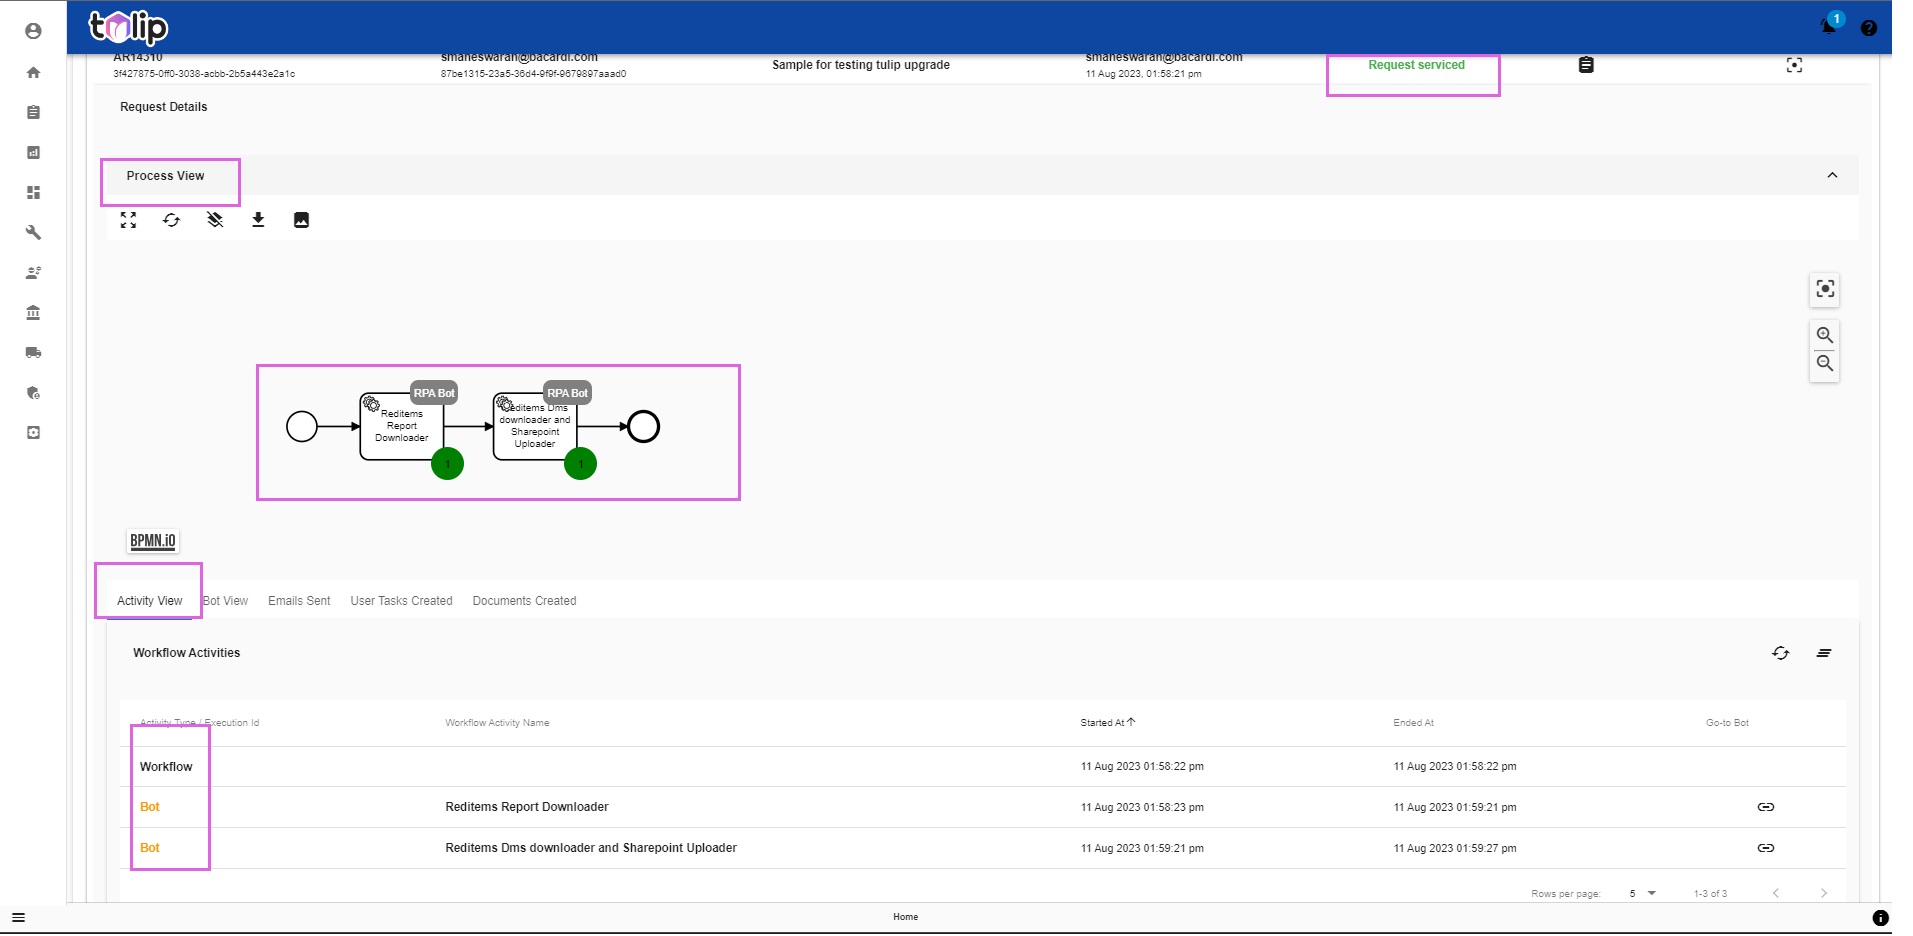
Now the status is "Request Serviced". You can see the updates on the Process view and the corresponding Activity View.
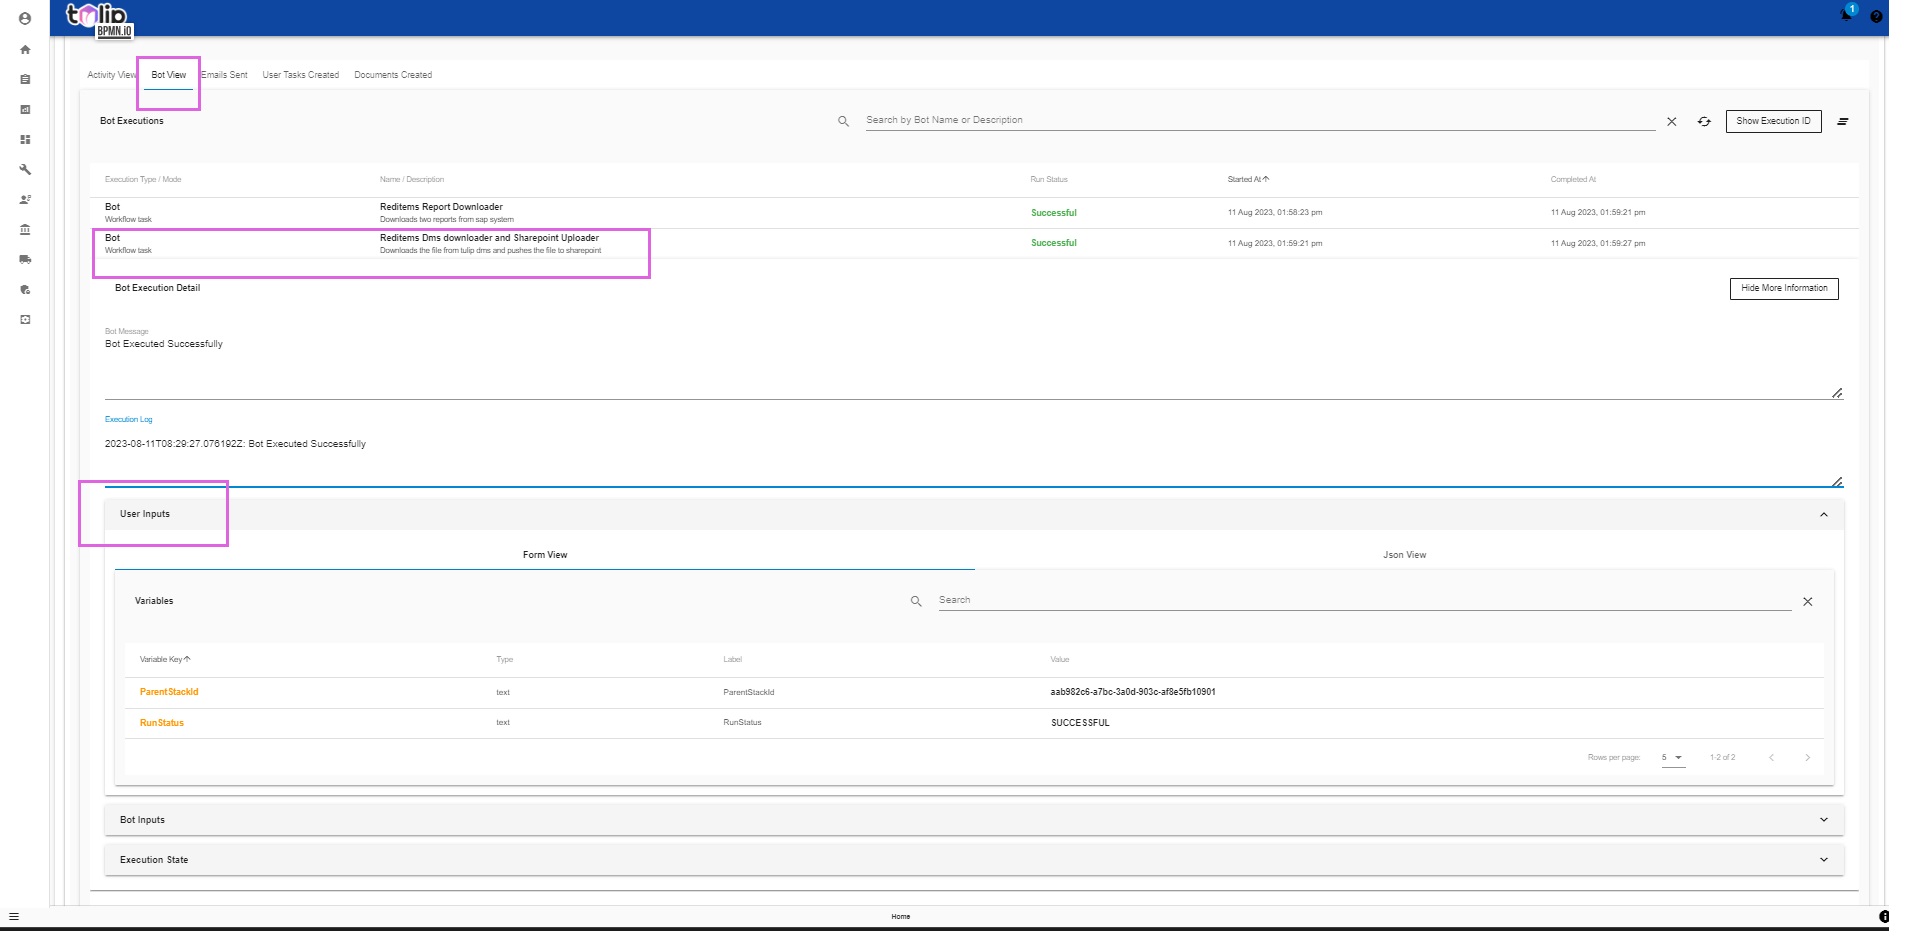
Under Bot View, you can view the bots and the detailled inputs and other parameters on the bots.
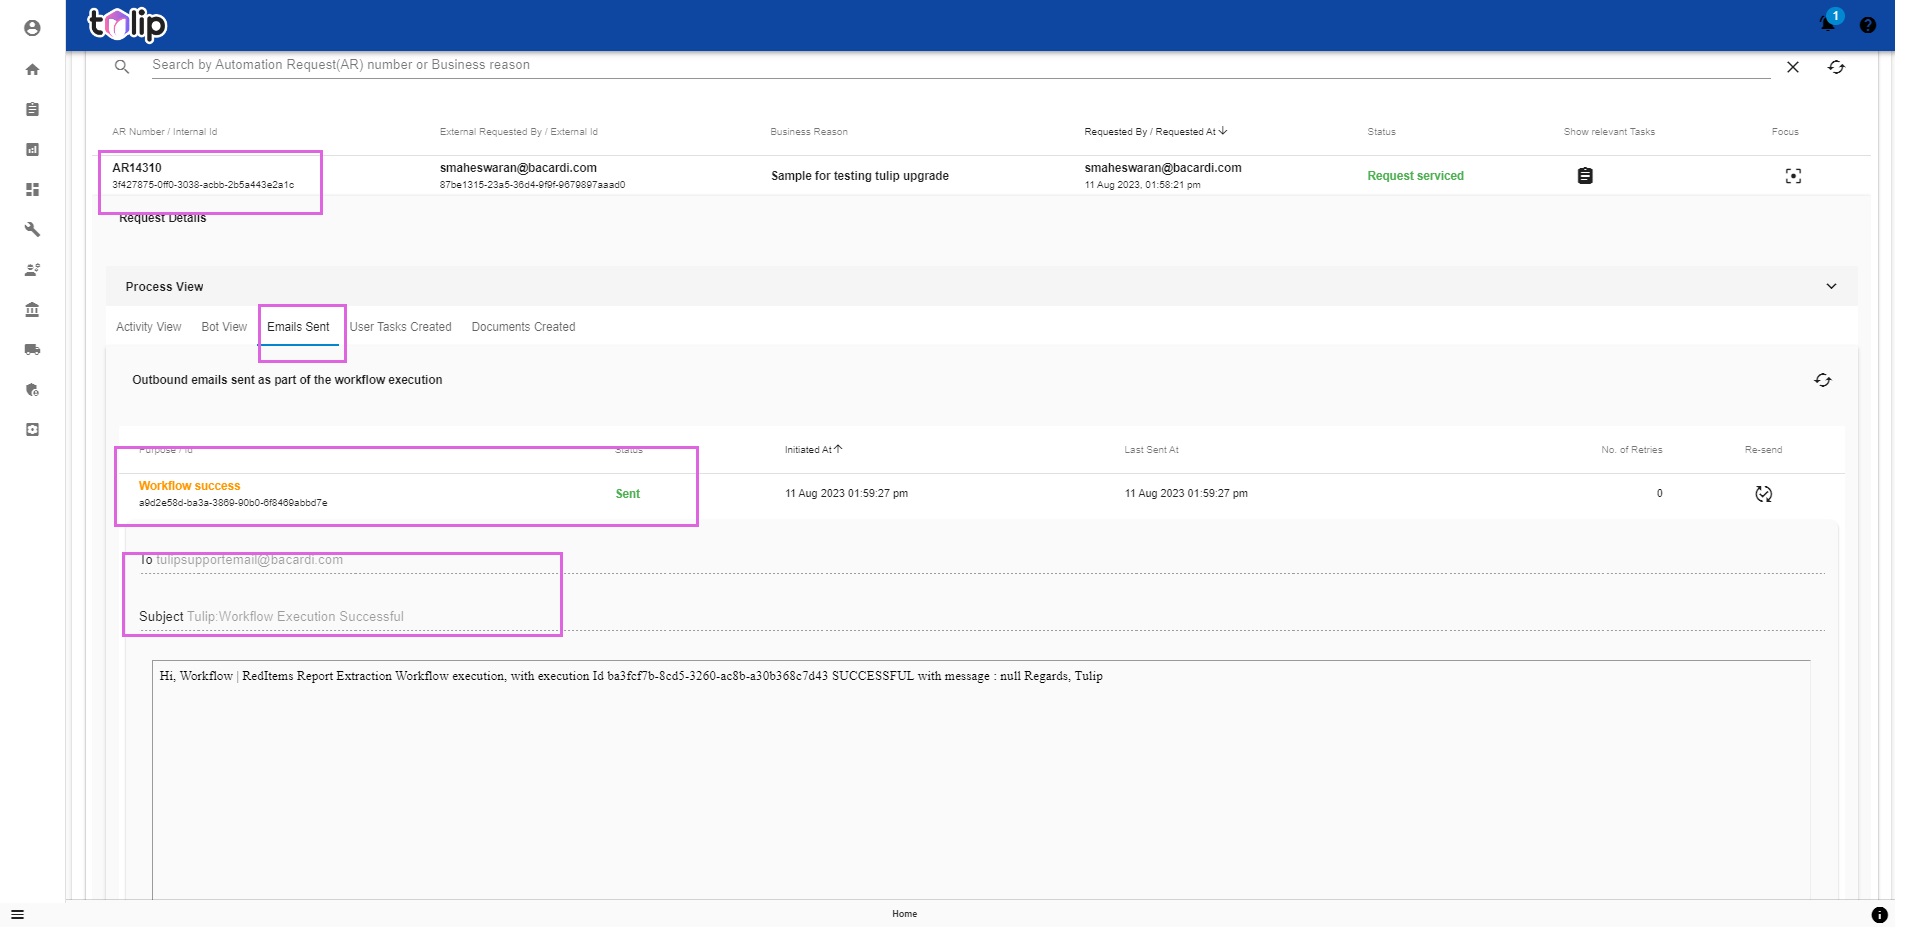
Under Emails sent, you can view the emails sent as part of the execution.
This particular automation service does not create any User tasks or any Documents. Hence the next two sections stay empty.